UX design and development
Custom intelligence software with a focus on UX design for the insurance and risk sector.

The Browser team was challenged by a global insurance provider to improve the way the company’s analysts calculate risk. Together, we developed Insights – a business intelligence platform that presents complex information from multiple sources clearly, thanks to a relentless focus on effective UX design. The platform is currently used by analysts around the world.
The Brief
The client was sitting on a burgeoning supply of risk data and needed to make this valuable information more readily accessible to analysts. Our task was to design and build a web application that could process data from multiple sources and surface valuable insights simply and quickly for analysts, within a single, user-friendly experience.
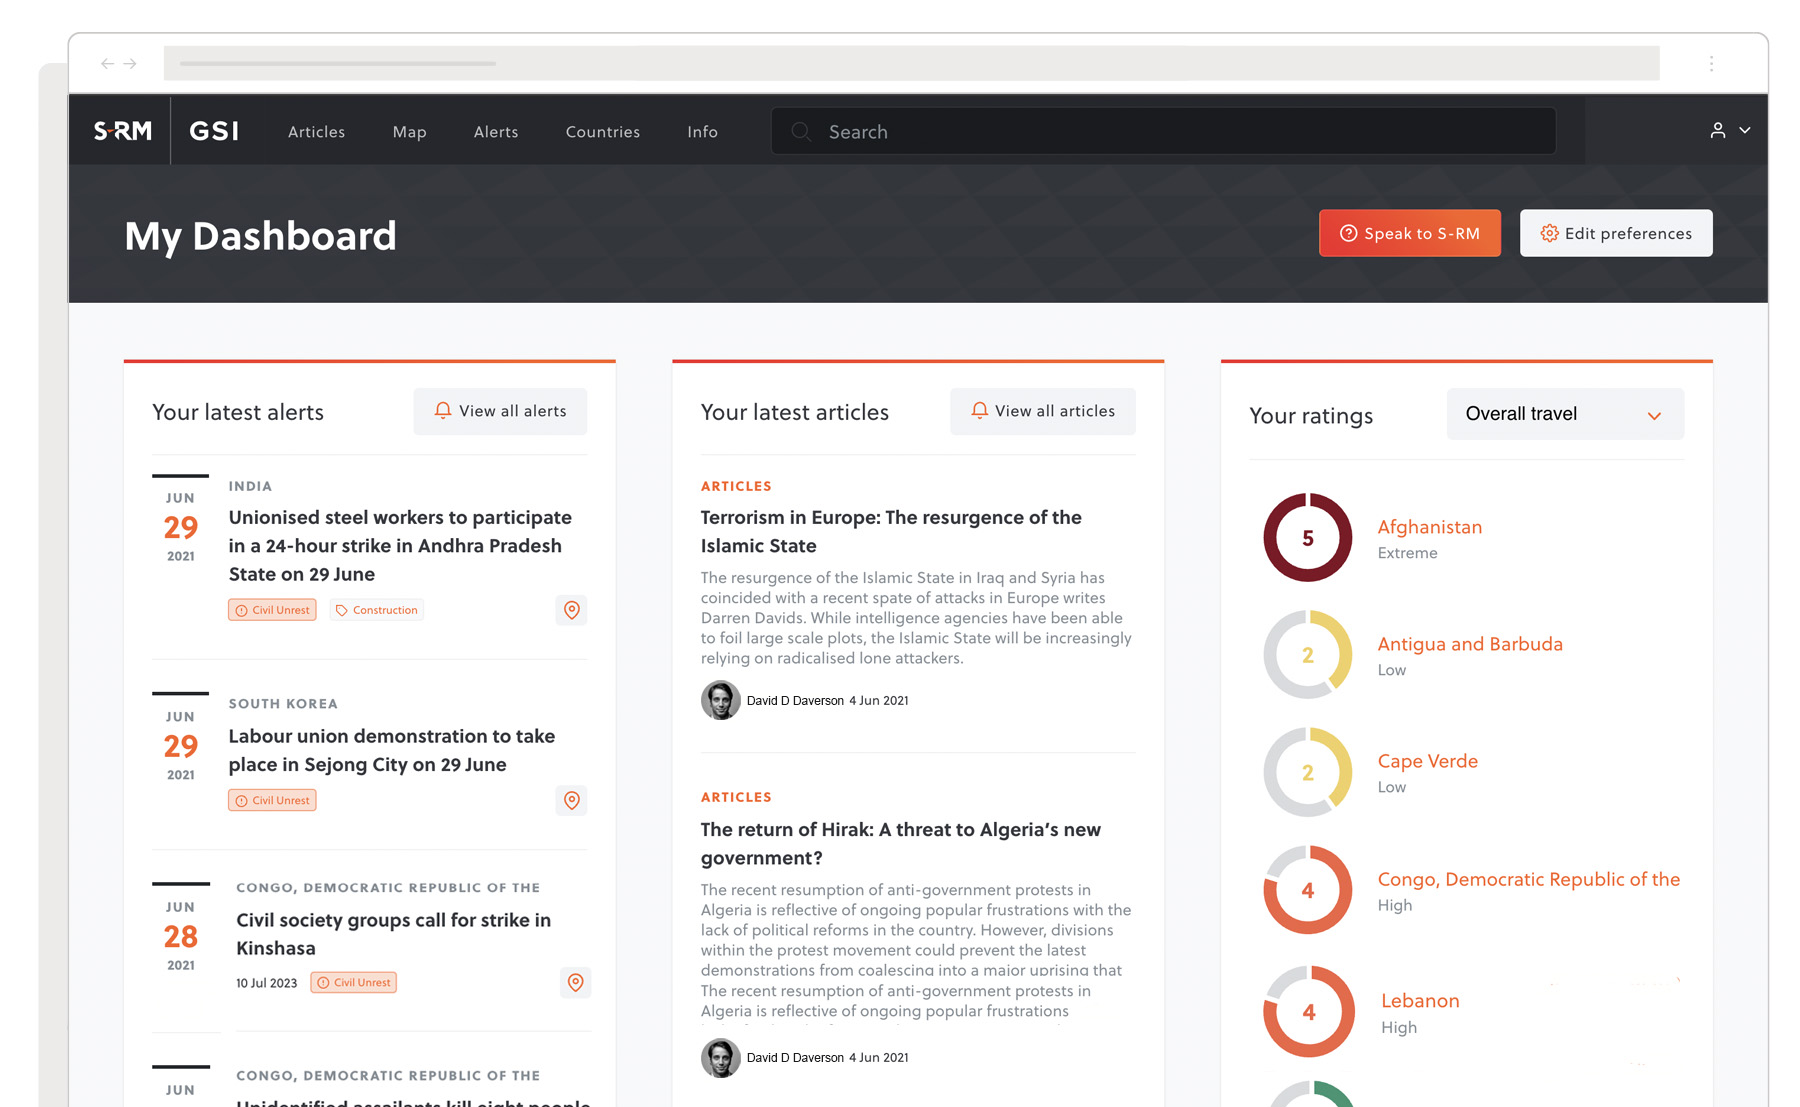
Our initial workshops highlighted the need for users to create their own dynamic display of information, and track any changes that occur within related geographical locations.
John Beck – Strategy Director
Working with analysts
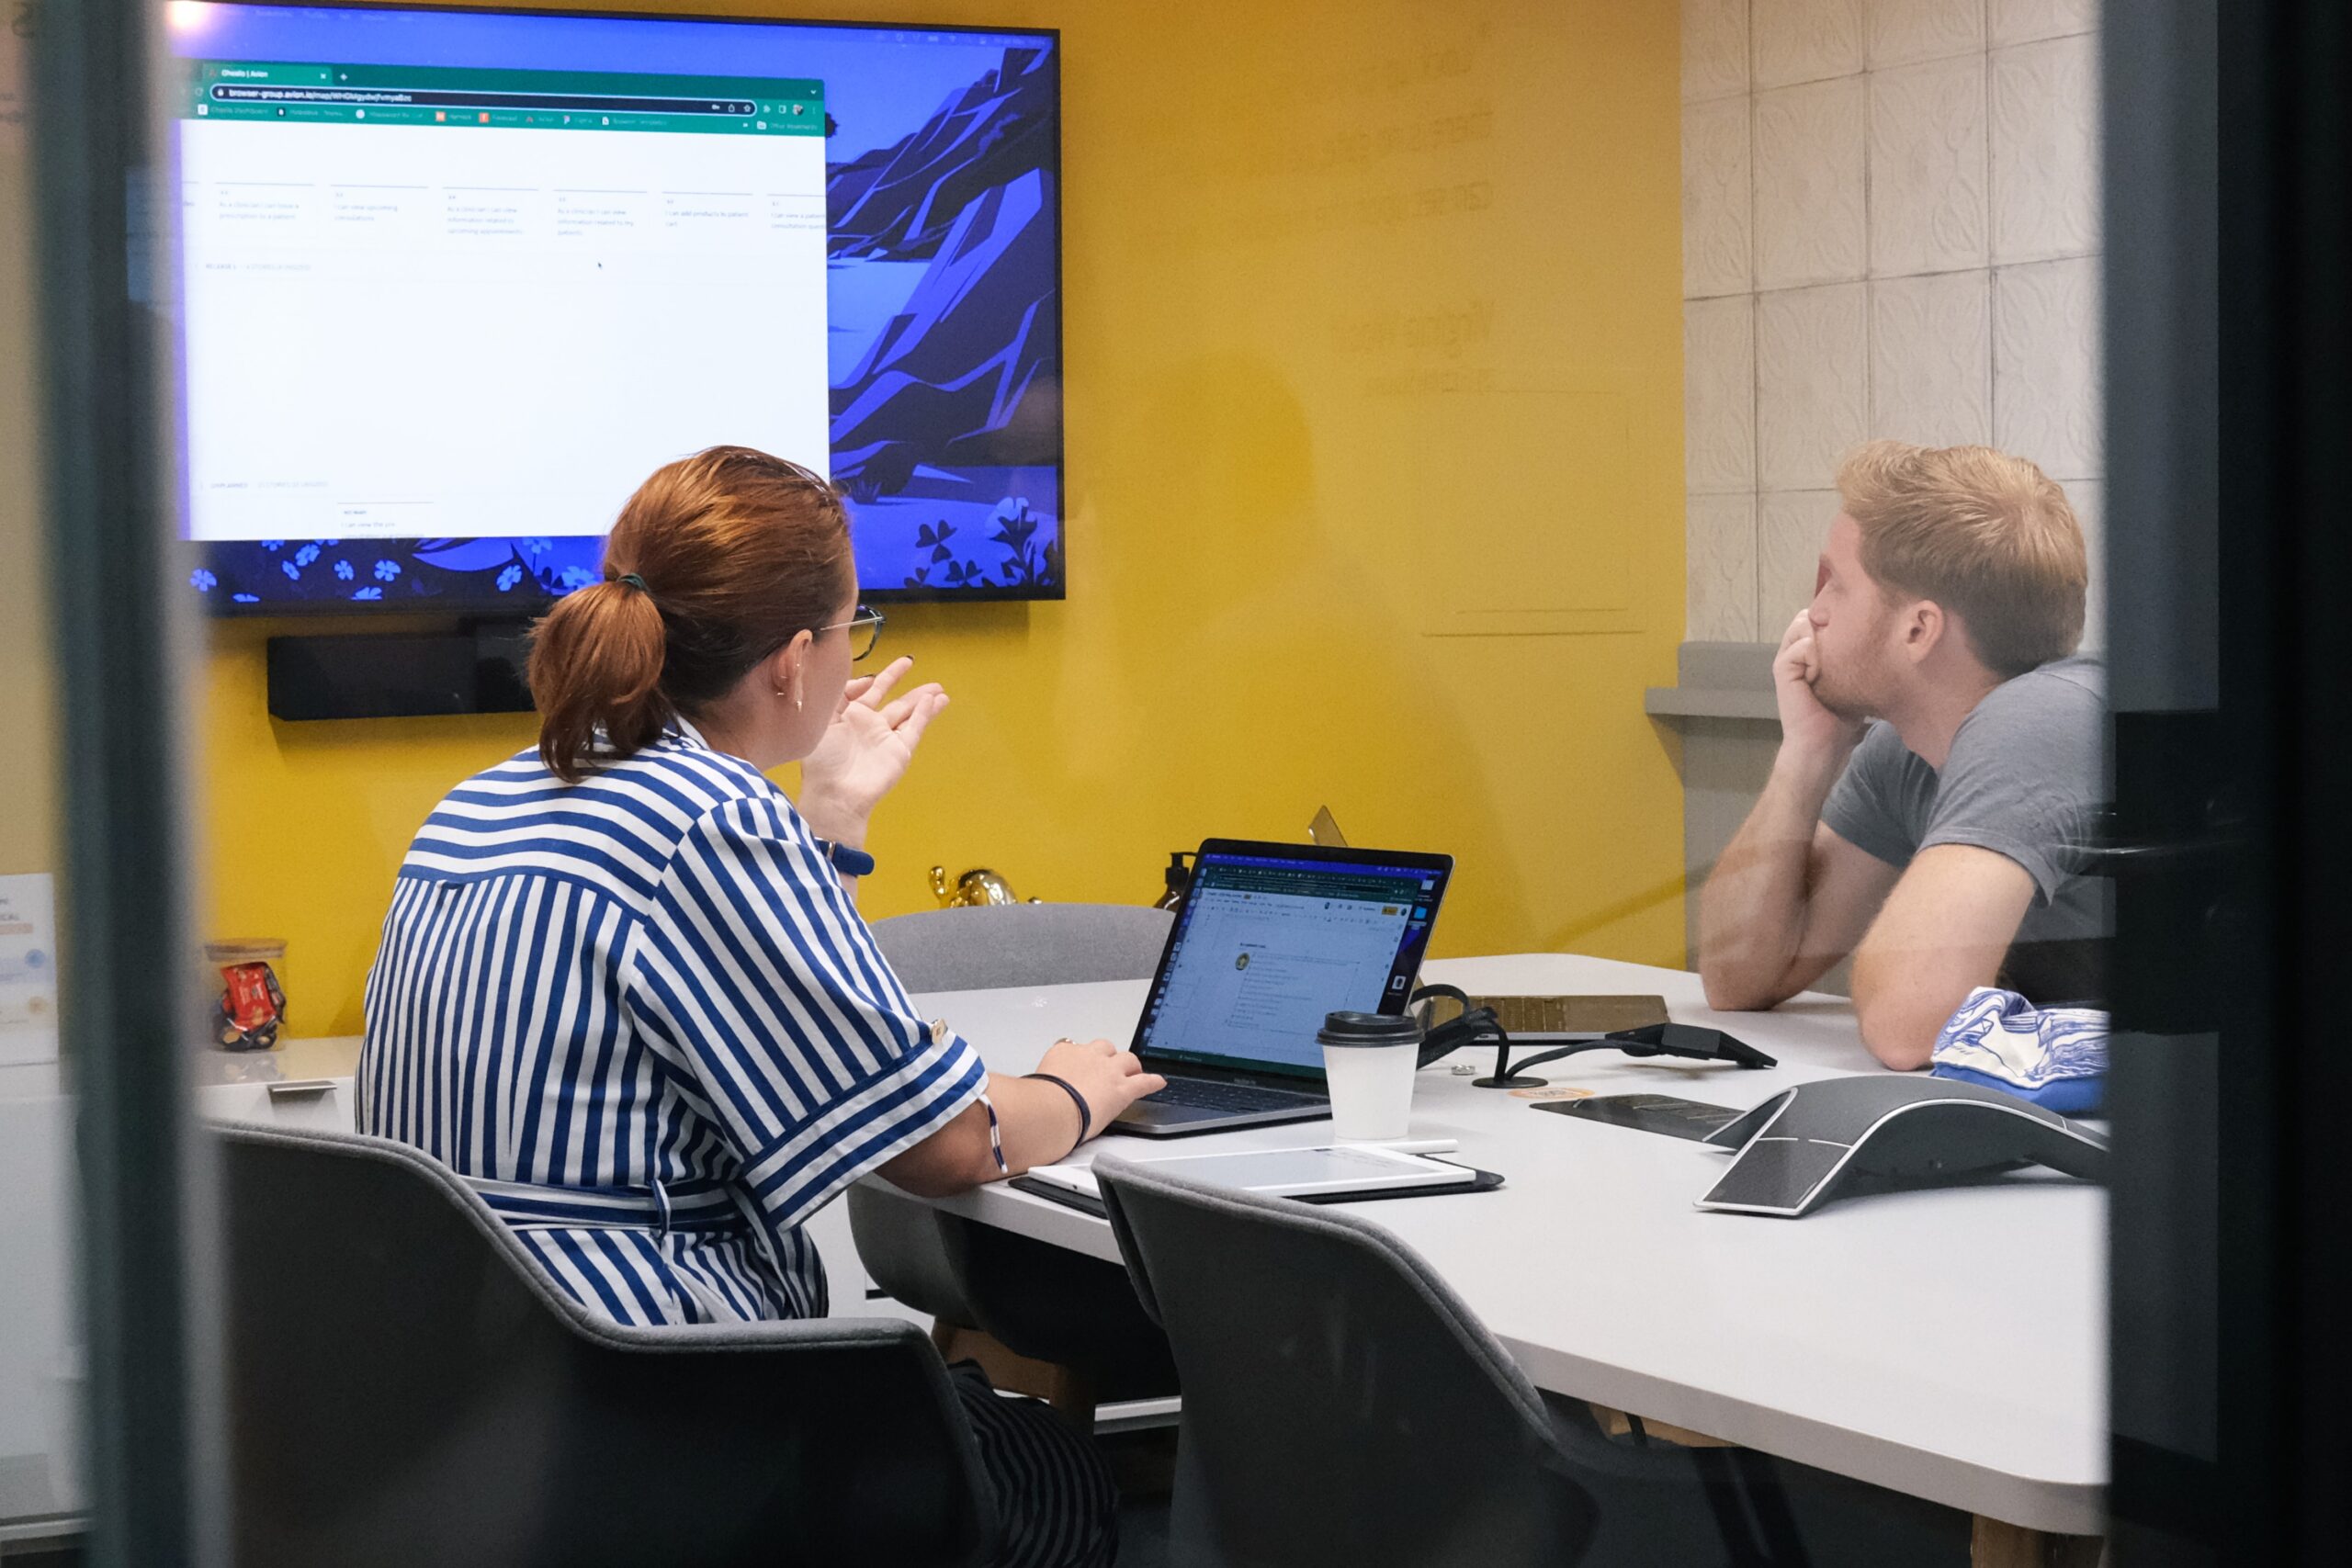
For six months the Browser team led a deep research project, interviewing underwriters, analysts and clients to understand how the company calculated risk. As part of this, we mapped out the entire user workflow; from the client request, through analysis, and to the final report. This original research gave us a holistic, top-down view of the user experience, allowing us to identify areas for improvement and to redesign the process from the ground up.
Working closely with our client, we started mapping out user needs using the MoSCoW method. We identified three key areas that were slowing the workflow down: data processing, inter-department communication and the production of client-facing reports. From these findings, we began prototyping ideas for a web platform inside which users could complete multiple risk assessments and management tasks at the same time.
Designing for data
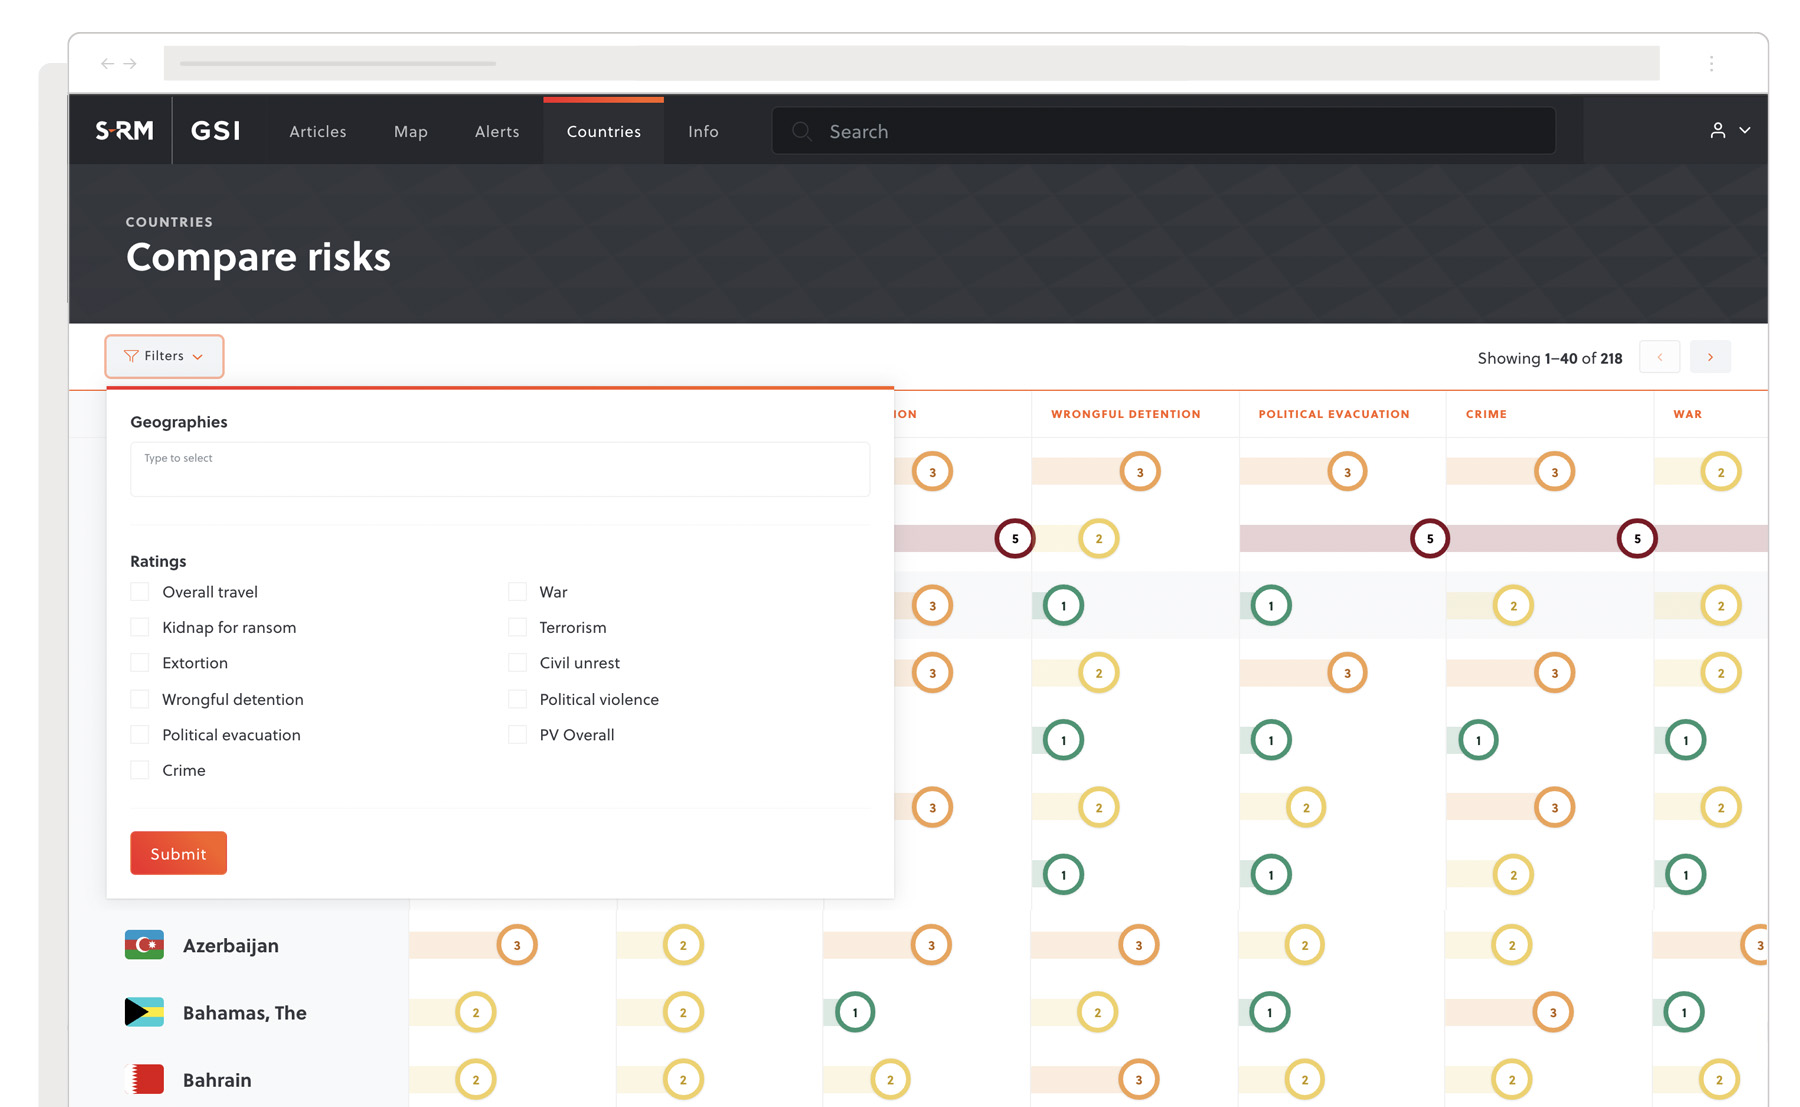
The result of our user experience research was that Insights was built around three core features: Maps, Charts and Reports. With Charts, users can visualise layers of information in multiple views, easily aggregating data via filters and templates to better understand a risk profile. This was integrated with the Reports module, which allows users to easily package up data that has been validated and categorised by TextRazor, an AI-based NLP system for deeper analysis by regional specialists.
Early user groups expressed a strong preference for visualised data. With Maps, we experimented with mapping live information onto geographical interfaces. Users can create their own dynamic display of incoming risk reports, entering assets manually or pulling live data from the other features.
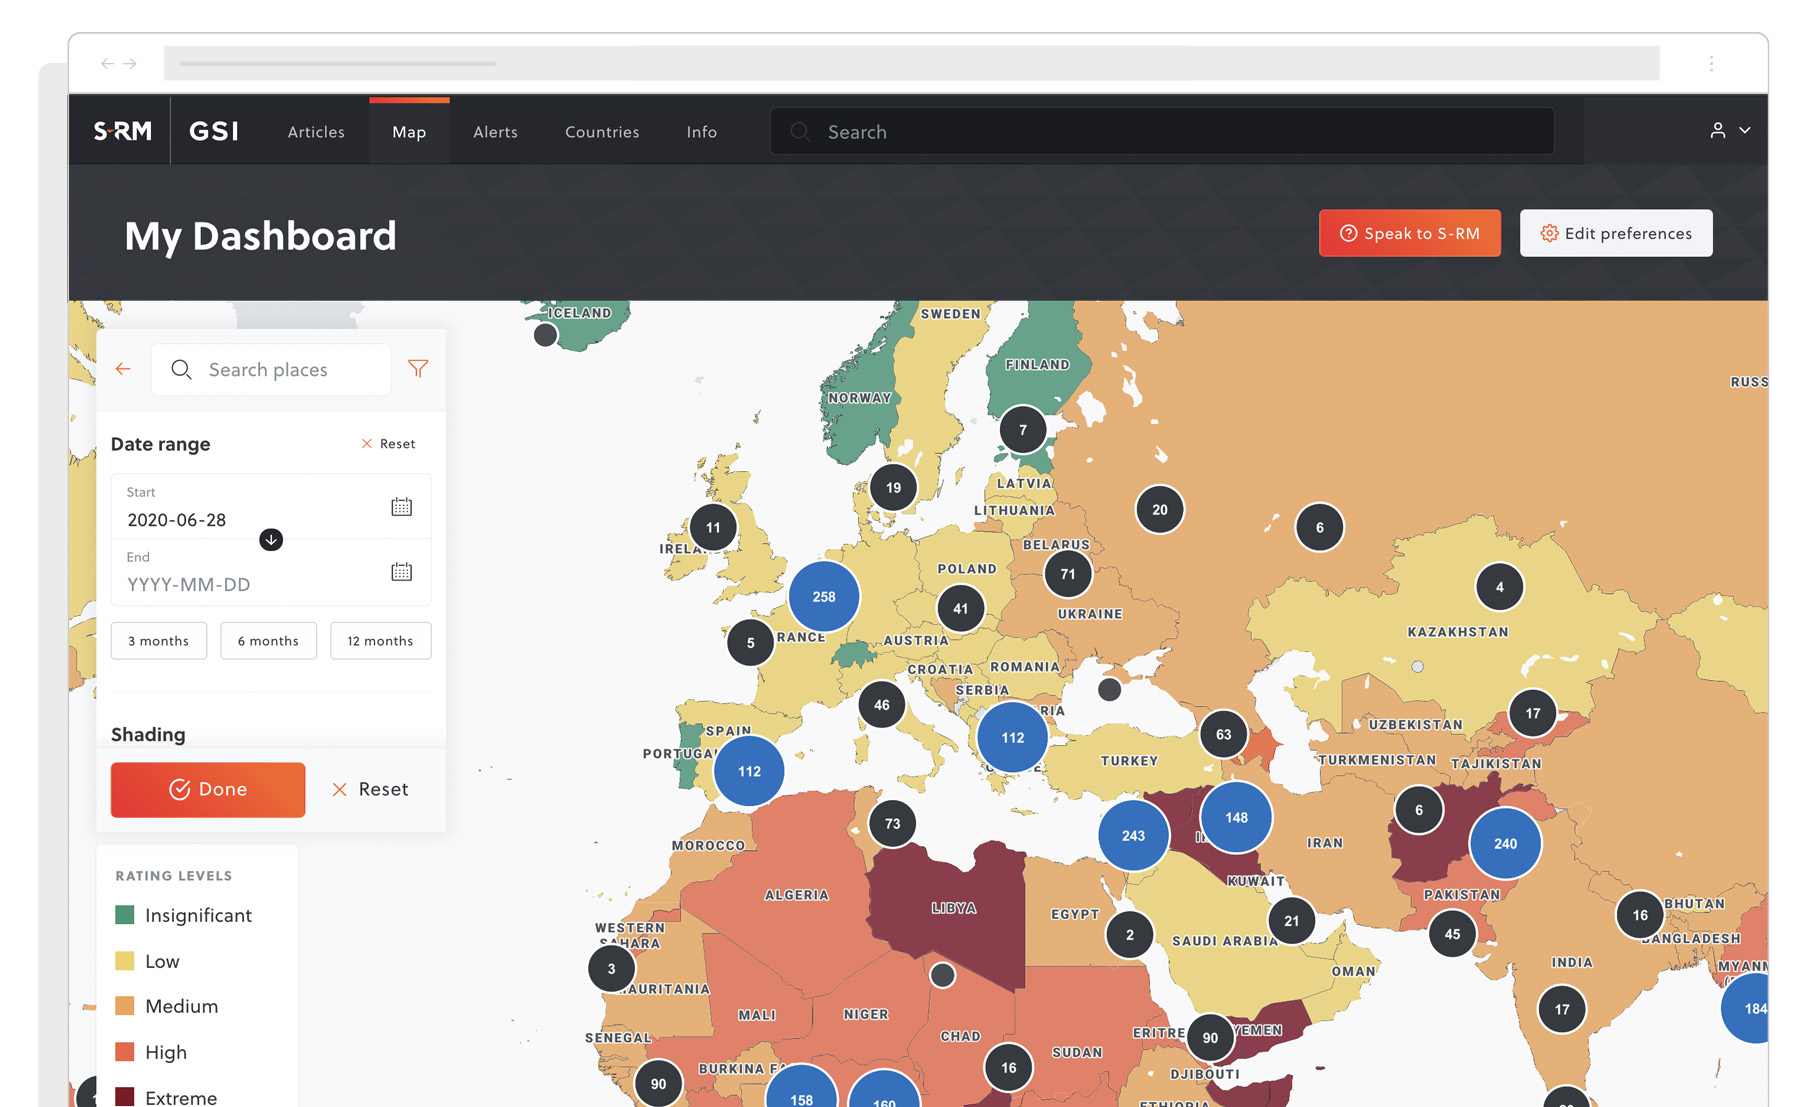
These features were built using React and D3.js, while Maps was built using Mapbox. These progressive frameworks combine the ability to create complex and interactive visualisations, with the flexibility to allow users to easily customise the platform.
UX design should be invisible to the user. Good design allows the user to engage without having to think about it. The insights provided by the discovery research phase allowed us to design an application that performed just that.
Iain Hector – UX Design Lead
From pilot to launch
To refine and improve the digital product we initiated a pilot phase prior to the global launch of the platform. As part of this, test users from partner firms were encouraged to experiment with the new functionality and give feedback. This real-world testing process produced a set of additional requirements and UX tweaks that were vital to making the finished product a success.
Piloting also helped us gather valuable insight into how much training users would need. With Insights, we were rolling out a new way of working that would be used by thousands of professionals across the world and we needed to have a robust launch and training programme in place to make sure the workflow changes were accepted.