SRM – Risk Intelligence
Designing a unified data investigation experience for the risk intelligence sector

Swan is a custom data investigation platform built for a risk intelligence sector client. It unifies multiple third-party APIs behind a single query interface, so analysts spend their time delivering assessments, not copy-pasting between systems. The challenge was not simply a technical one: it was how to design a platform that created efficiency, but also fostered team cohesion and genuine integration between departments that had previously been working in silos.
A fragmented process that didn’t scale
Risk intelligence analysts build complete pictures of subjects by interrogating multiple specialist data providers. Sanctions lists, corporate registries, adverse media feeds, politically exposed person databases, each lives in a separate platform, with its own query language, its own data structure, and its own way of presenting results. For analysts doing this work every day, navigating that ecosystem is a significant and largely invisible tax on their time.
That was the problem our client came to us with. Analysts were running identical searches across five separate systems, interpreting incompatible result sets, and manually stitching insights together before they could even begin the assessment work they were actually hired to do. It was time-intensive, error-prone, and it didn’t scale. As the team grew and caseloads increased, the friction compounded.
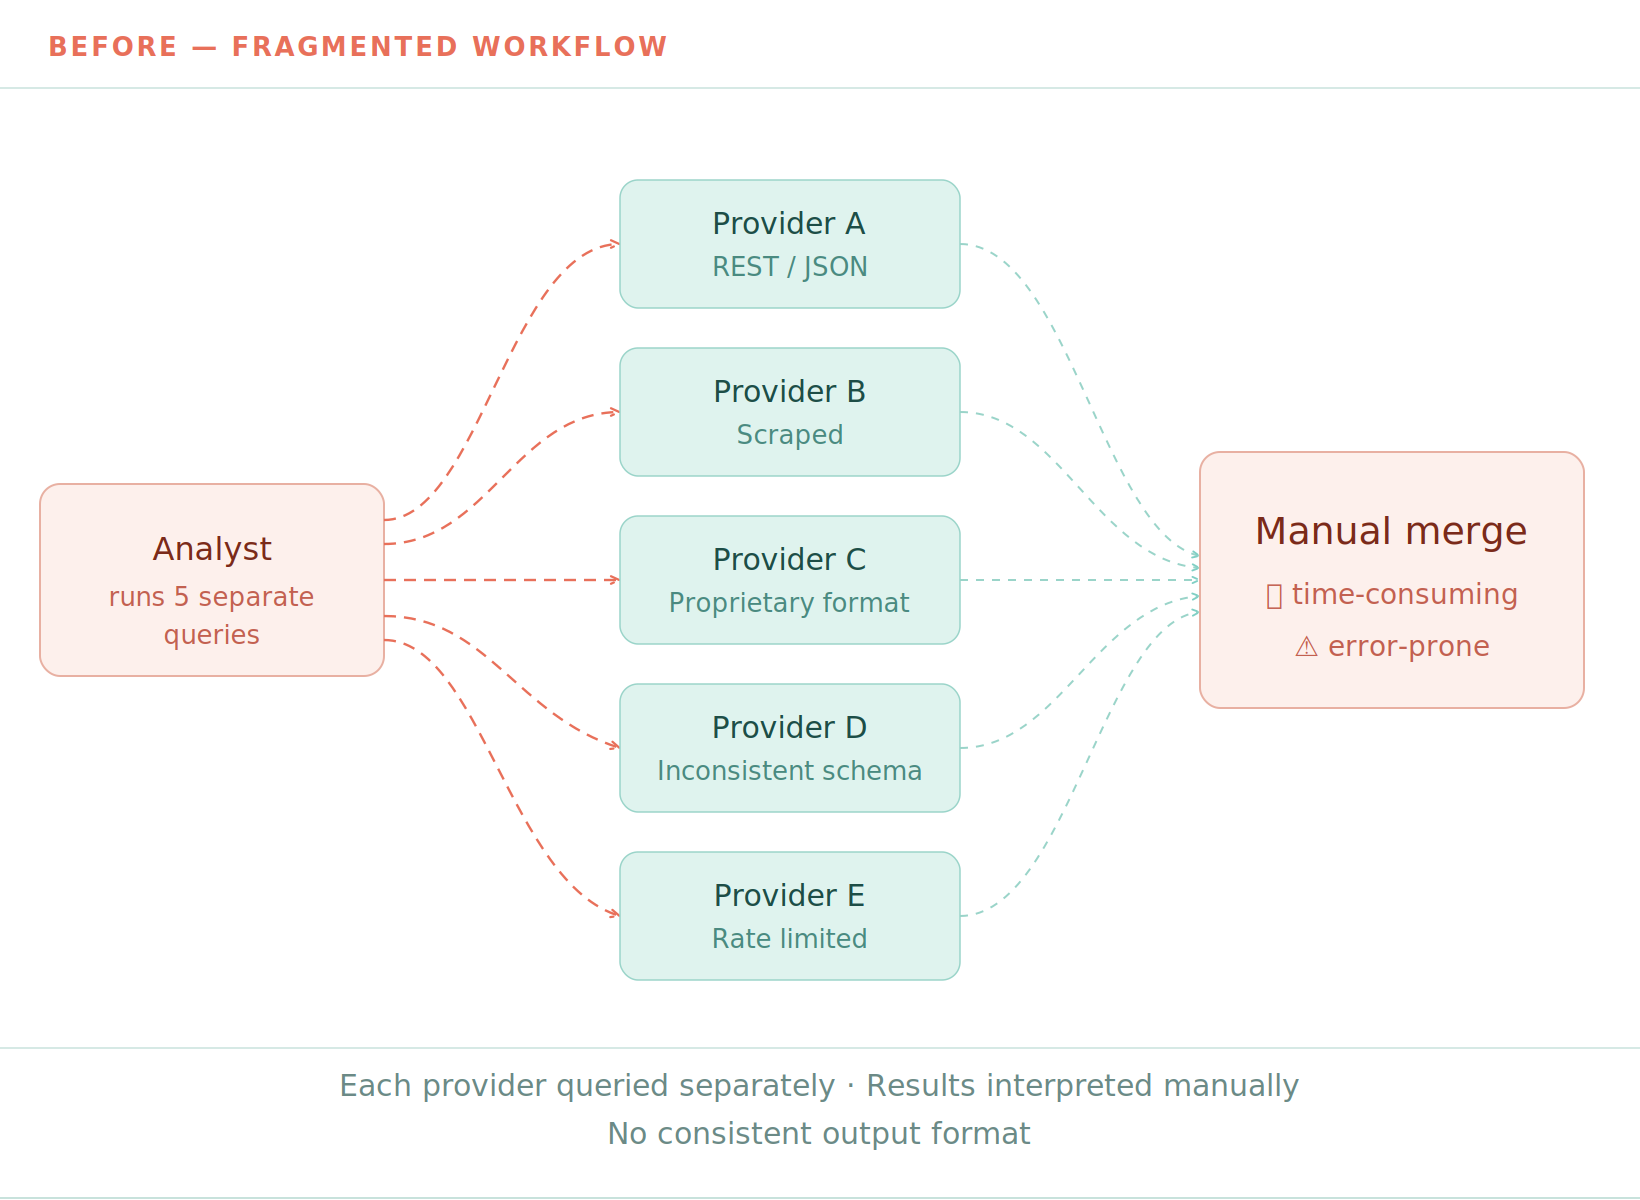
The brief was clear: build something that removes that operational grind, without removing the analyst’s judgement or control.
Design & data sharing the same constraints
We began with a structured discovery phase, working closely with analysts across different seniority levels and departments. Rather than focusing purely on what the product should do, our interviews explored how analysts actually thought about investigations, what a good result looked like to them, where they lost confidence in data, and how they currently compensated for the gaps between systems.
This research surfaced two things that shaped everything that followed.
First, the problem was not just one of efficiency. Different departments had developed different workarounds, which meant they were often drawing different conclusions from the same underlying sources. A unified platform was an opportunity not just to save time, but to create a shared standard for how investigations were conducted and how results were interpreted.
Second, analysts were not always familiar with the capabilities and limitations of each individual data provider. The current tools assumed a level of vendor-specific knowledge that created inconsistency across the team, particularly for less experienced analysts.
We ran a series of design sprints that brought analysts, department leads, and technical stakeholders into the same room, working from the same evidence. These sessions broke down what mattered to individual users, to departments, and to the business, and surfaced tensions between those priorities early, before they became expensive to resolve in code.
Simultaneously, we conducted a deliberate audit of the vendor ecosystem, mapping what each provider could deliver, how its data was structured, and where the gaps or overlaps were. That investigation shaped both the design and the architecture from the outset, rather than the two disciplines discovering the same problems independently.
A shared foundation. The standardised query model
The technical and design work converged on a single central problem: how do you present a unified interface over sources that are fundamentally inconsistent?
The answer was a standardised query model that became the contract between the front end and the integration layer. It had to represent every provider’s capability whilst remaining simple enough for analysts to use without friction. Every design decision about what analysts could query, filter, and compare had to be grounded in what the underlying providers could actually support. Every engineering decision about how results were structured had to be grounded in how analysts needed to read and act on them.
This meant the front end and integration layer had to be designed together, not handed off sequentially. The interface couldn’t assume clean, synchronous responses, it had to be built around provider uncertainty as a given. Some sources are slower. Some return partial data. Some fail silently. The design had to make that complexity visible and manageable, rather than hiding it in a way that eroded analyst confidence.
On the engineering side, each vendor was connected through an isolated lightweight client, keeping complexity contained so that adding or replacing a provider never put the rest of the system at risk.
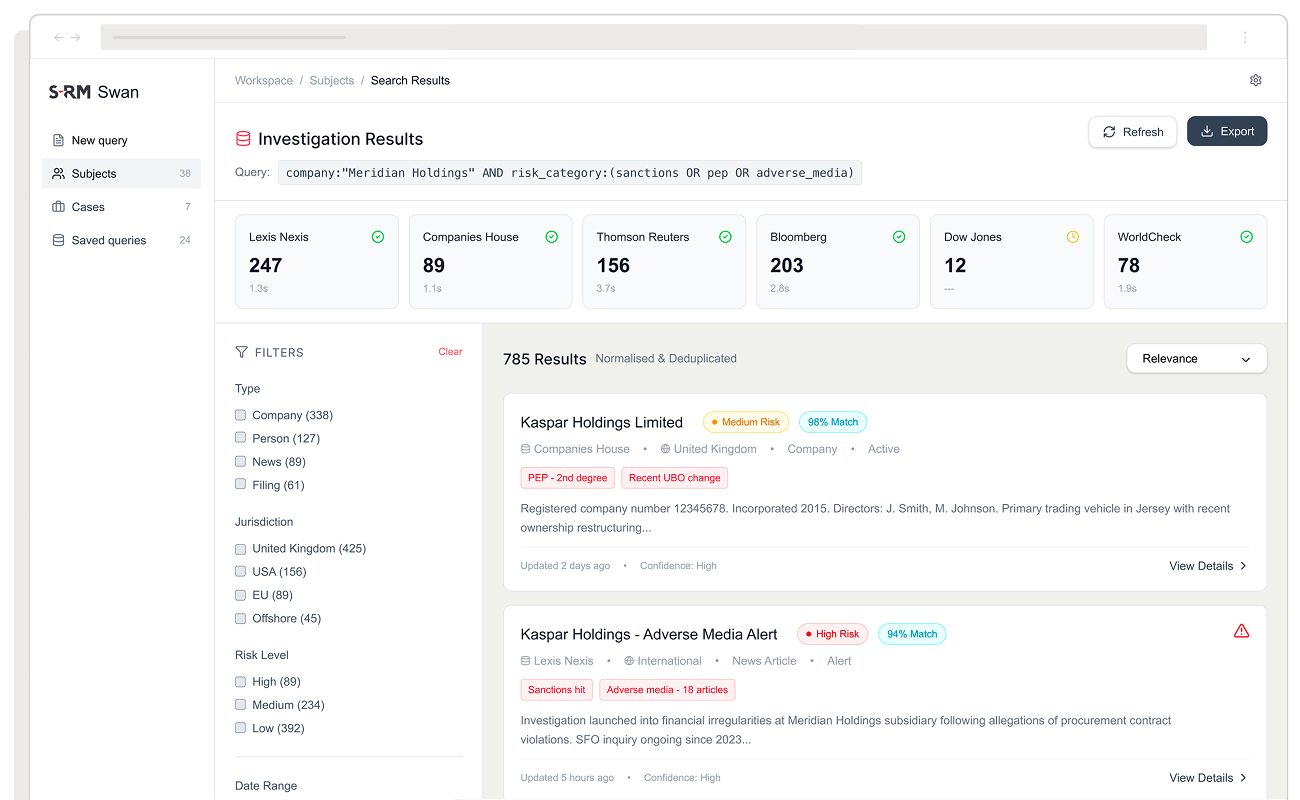
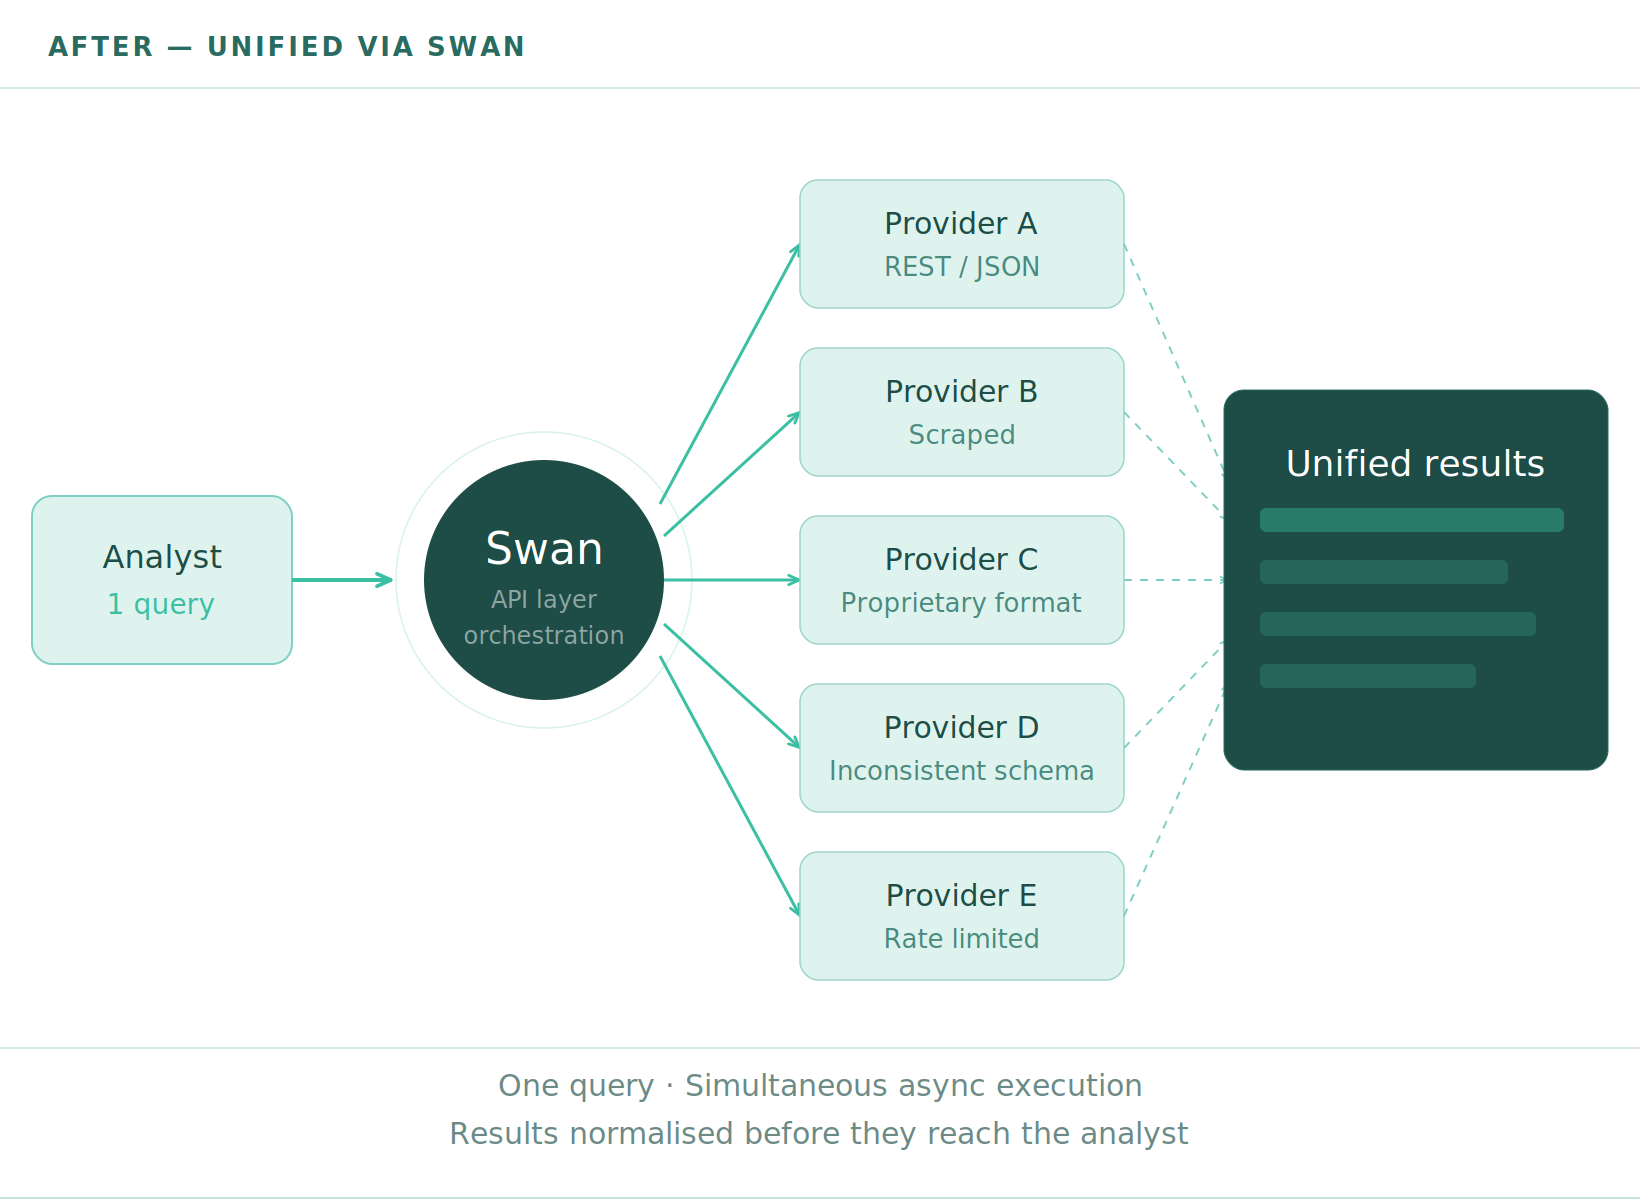
One query. Every source. A normalised result.
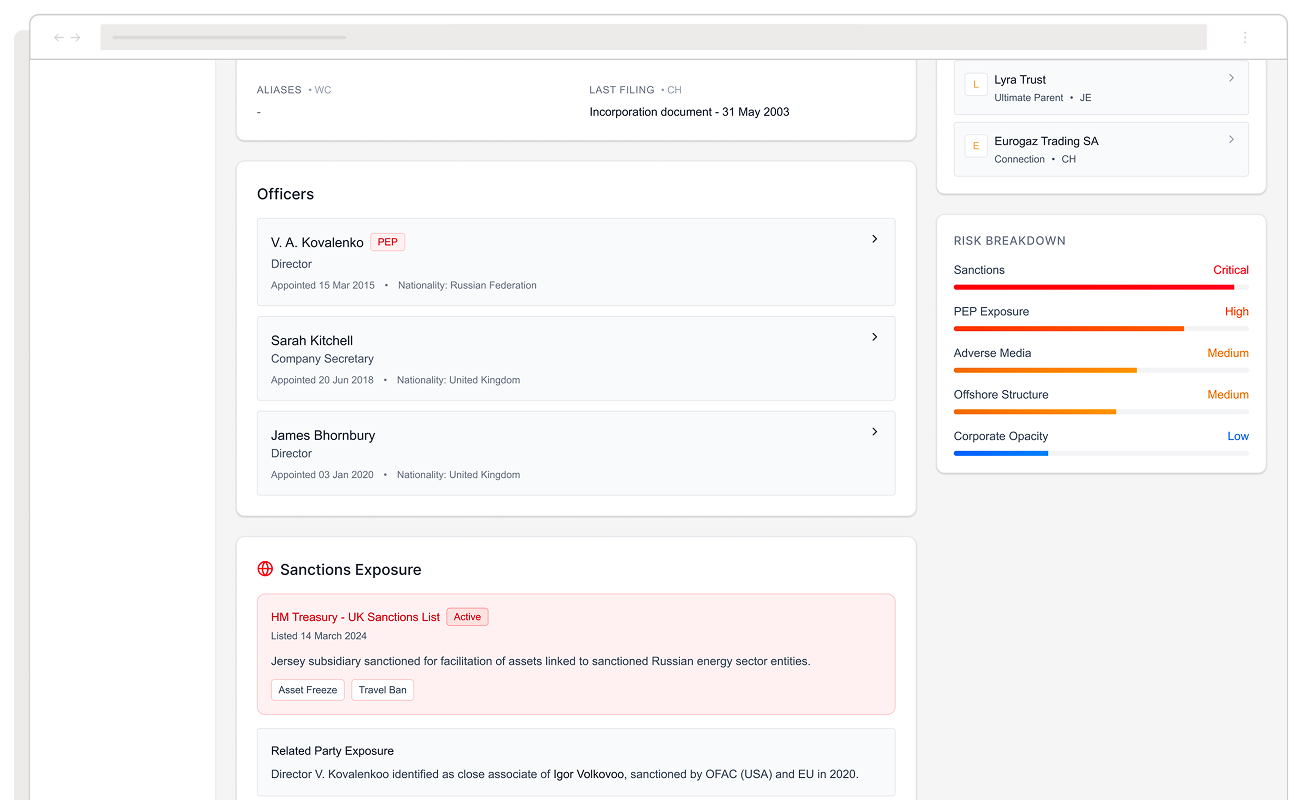
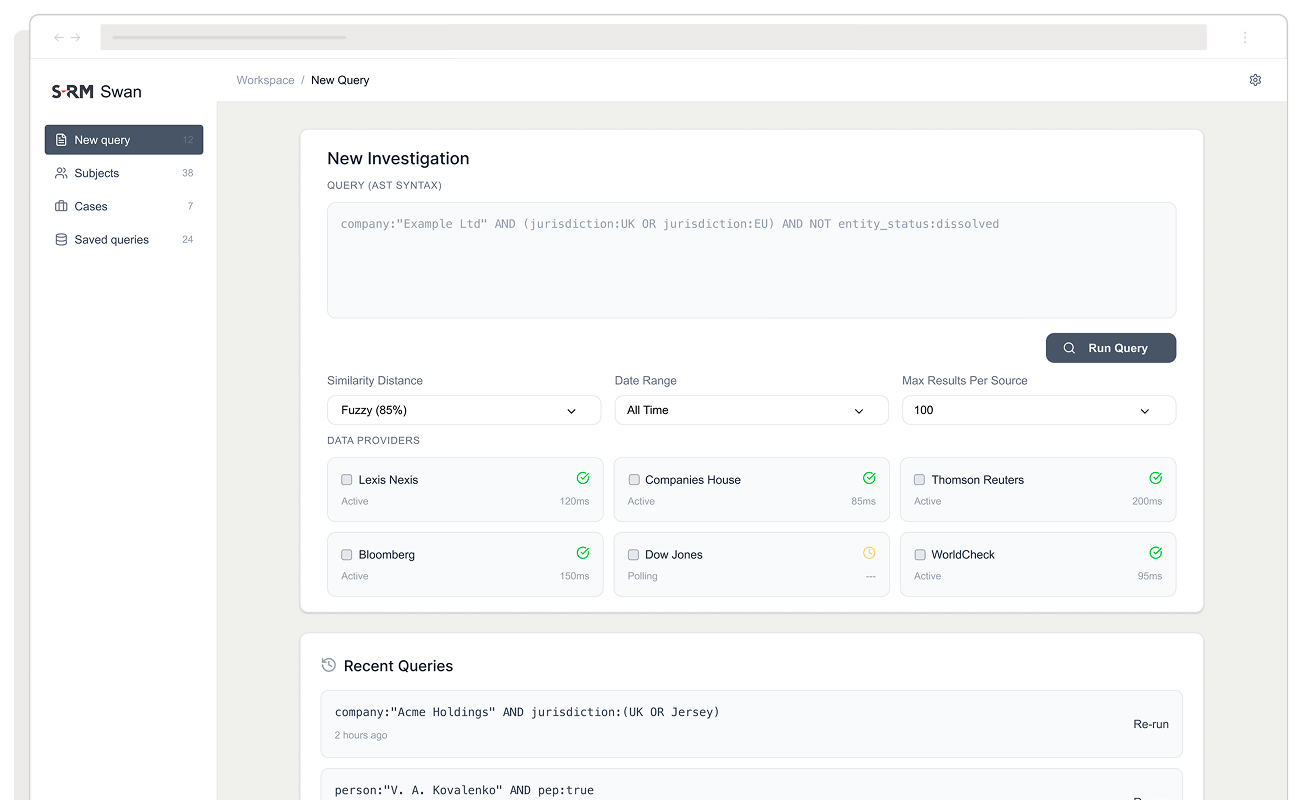
Swan sits as an intelligent intermediary between the analyst and the entire provider ecosystem. A single standardised query is entered once, translated automatically into each provider’s native syntax, and dispatched simultaneously. Results are normalised into one consistent structure before they reach the screen.
The analyst sees none of the underlying complexity. They see clean, comparable data, regardless of how inconsistent the sources are beneath it.
During query execution, the interface provides real-time visibility into provider status: which sources are responding, which are delayed, and how results are being aggregated. This was a deliberate design decision rooted in the research. Analysts told us that trust in a platform was closely tied to understanding what it was doing. A spinner with no information bred uncertainty. Transparent progress built confidence.
A platform that thinks like an analyst, not a system
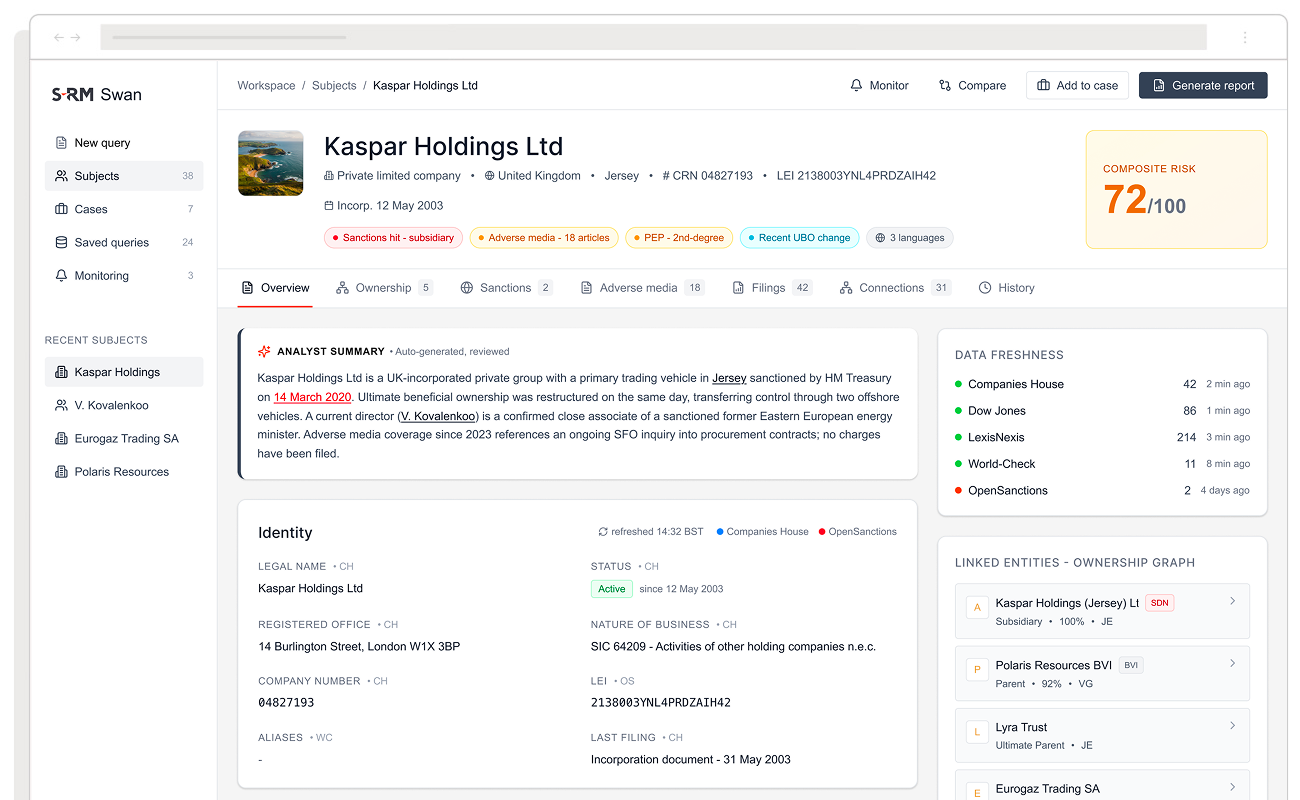
The outcome is a fundamentally different way of working. Analysts run complex multi-source investigations in a fraction of the time, with results that are consistent, comparable, and ready for downstream use. The shared query model and normalised output format also means that different departments are now working from the same evidential foundation, which has reduced inconsistency in how assessments are written and reviewed.
Less experienced analysts benefit disproportionately. The platform surfaces provider capabilities without requiring them to know each system individually, which has raised the floor on the quality of investigations across the team.
What Swan demonstrates is that the hardest problems in data-heavy platforms are rarely purely technical. The architecture matters, but so does understanding how analysts think, where they lose confidence, and what it actually feels like to use a tool for eight hours a day. Getting those two things designed together, from the start, is what makes the difference.