Analytics Dashboard Design Agency
Elevate Your Customers Digital Experience with Expert Dashboard Design
Turning your information into actionable insights
Most organisations are sitting on more data than they know what to do with. The gap between having information and actually using it comes down to how it is presented. At Browser, we specialise in crafting analytic dashboard experiences and interfaces that make complex data legible, useful, and genuinely engaging for the people who rely on it every day. Collaborating closely with your team, often alongside existing IT or engineering teams, we focus on designing and delivering seamless front end solutions built around your data.
Our experience spans a wide range of analytic domains, from risk and compliance through to operational performance, sales and marketing, and customer intelligence. We operate in complex environments, working with partner services to integrate technologies such as sentiment analysis and neuro symbolic AI, enabling us to deliver effective analytic outcomes at pace. We have successfully delivered design solutions for a diverse portfolio of clients, including:


Why choose Browser for your dashboard design and front-end development?
- User Centric Approach We prioritise your users and your organisation’s goals by conducting thorough research, including product audits, competitor analysis, and customer interviews.
- Seamless Design Process Our design sprints and user journey mapping ensure every analytic dashboard aligns with your business objectives and delivers a cohesive, considered user experience.
- Rapid Prototyping We develop interactive prototypes to visualise the dashboard’s functionality, allowing for iterative improvements based on real user feedback.
- Expert Development Our front end development team integrates the design with your existing data systems, ensuring a responsive, performant, and efficient analytic dashboard.
- We balance compliance with comprehension, making sure to serve both the organisation and the end user equally.
Our dashboard design services typically include:
A professional service line approach to dashboard design ensures that every aspect of the user interface is tailored to the needs of your audience and aligns with your business goals.
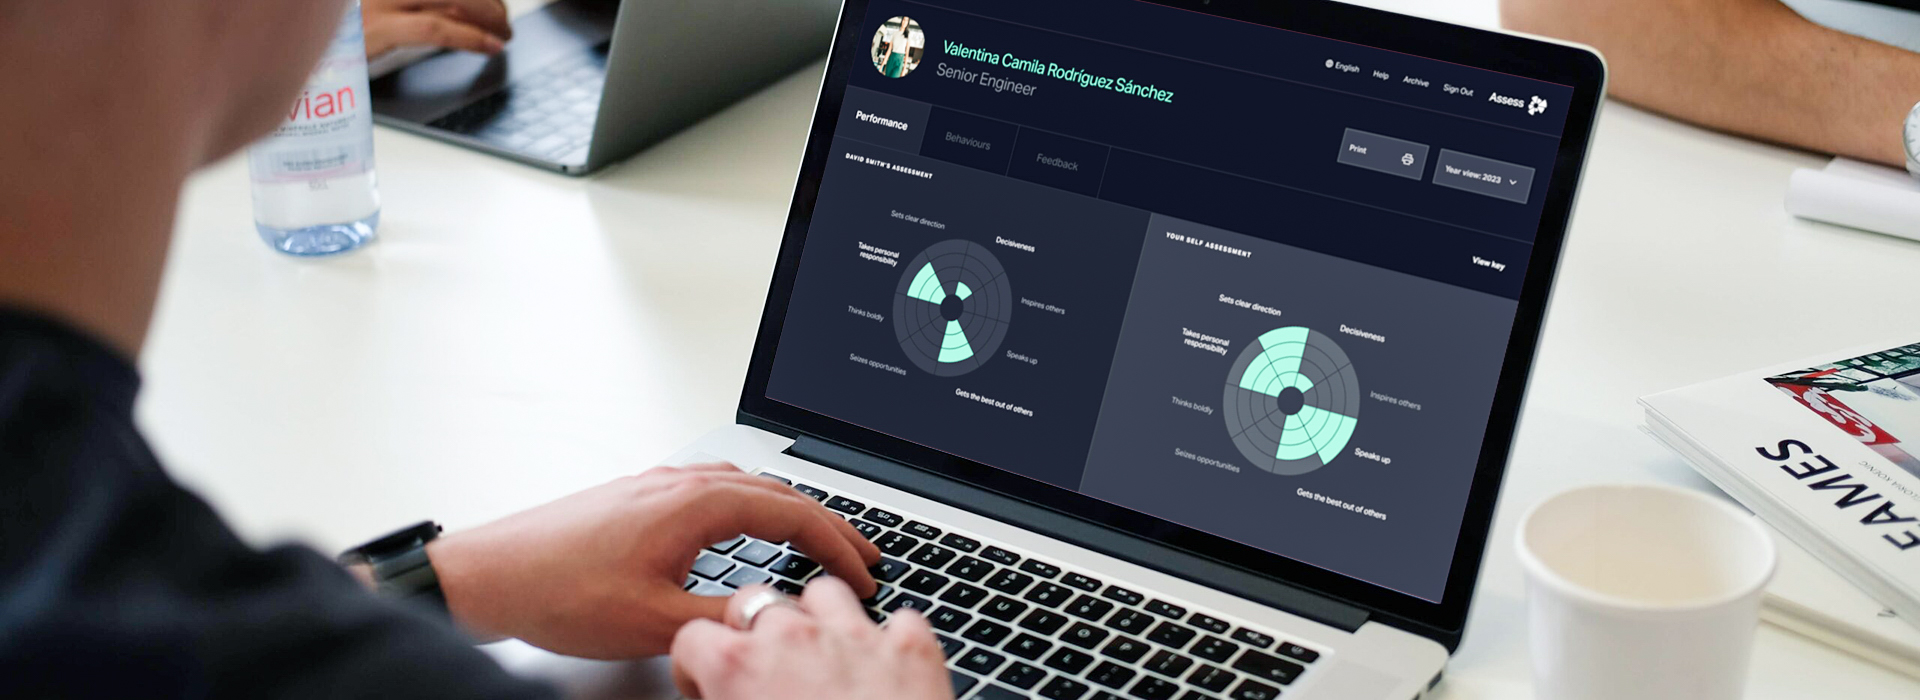
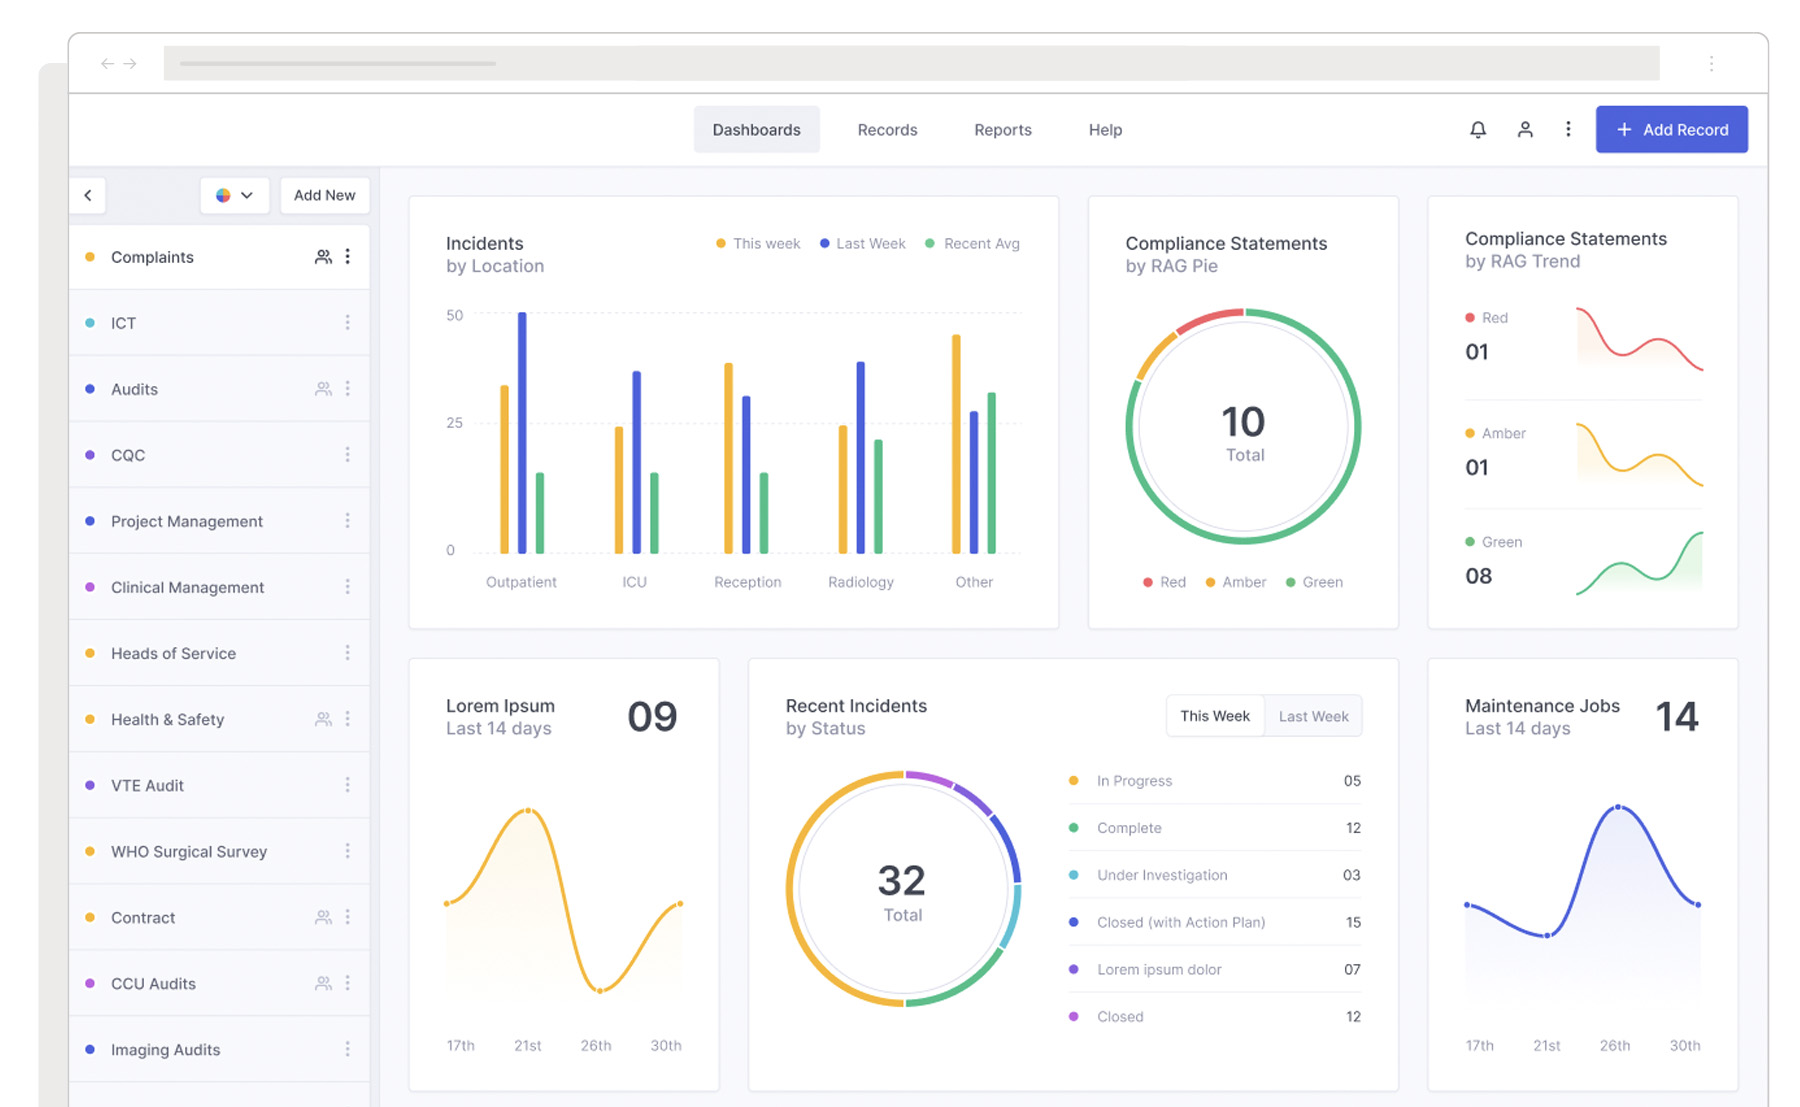
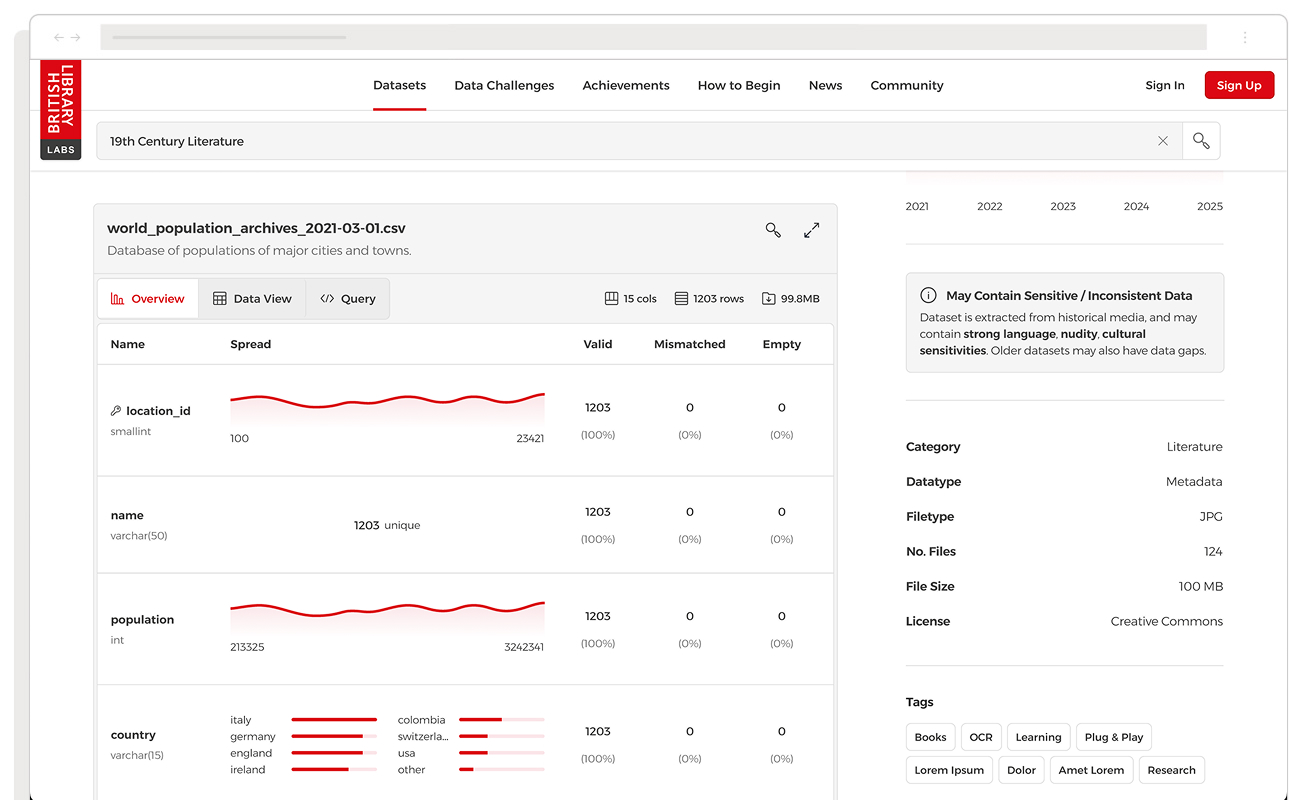
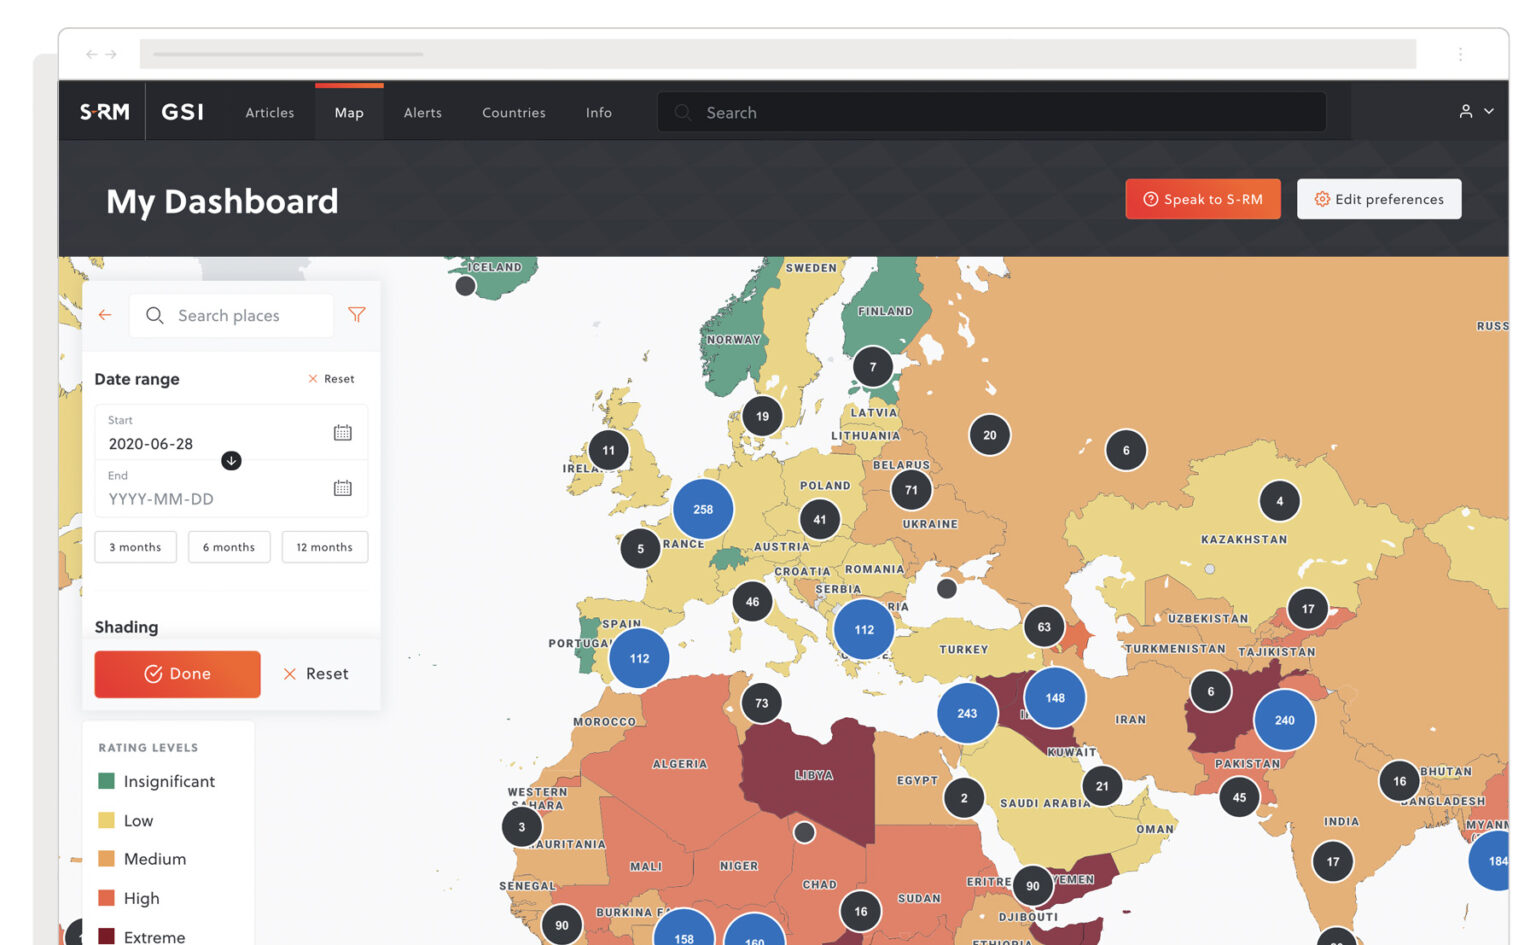
- A good analytic dashboard does not just display data. It tells people what to pay attention to, helps them understand why it matters, and makes the next step obvious. Getting there requires rigour at every stage, from research and design through to development and testing.
- User Research Comprehensive analysis to identify user needs and data preferences. We use this research to drive every design decision from the ground up.
- UX and UI Design Creating intuitive user interfaces that enhance engagement whilst delivering an elegant, informative, and analytical experience.
- Front End Development Implementing the design with clean, efficient code that is performant and built to scale as your data and user base grow.
- User Testing Validating the dashboard’s usability and effectiveness through real world user testing and continuous refinement.
What to expect from our expert design and development team
Enhances Usability Poor dashboard design forces users to work harder than they should. By understanding how people actually interact with data, we create layouts that make it straightforward to navigate, interpret analytics, and take action. This reduces cognitive load and improves efficiency, particularly for dashboards handling large or intricate datasets.
Aligns with Business Goals Our analytic dashboard designers work closely with stakeholders to ensure the solution earns its place. Whether it is tracking KPIs, monitoring operational performance, or surfacing customer intelligence, the design aligns with the strategic goals of your organisation rather than just looking the part.
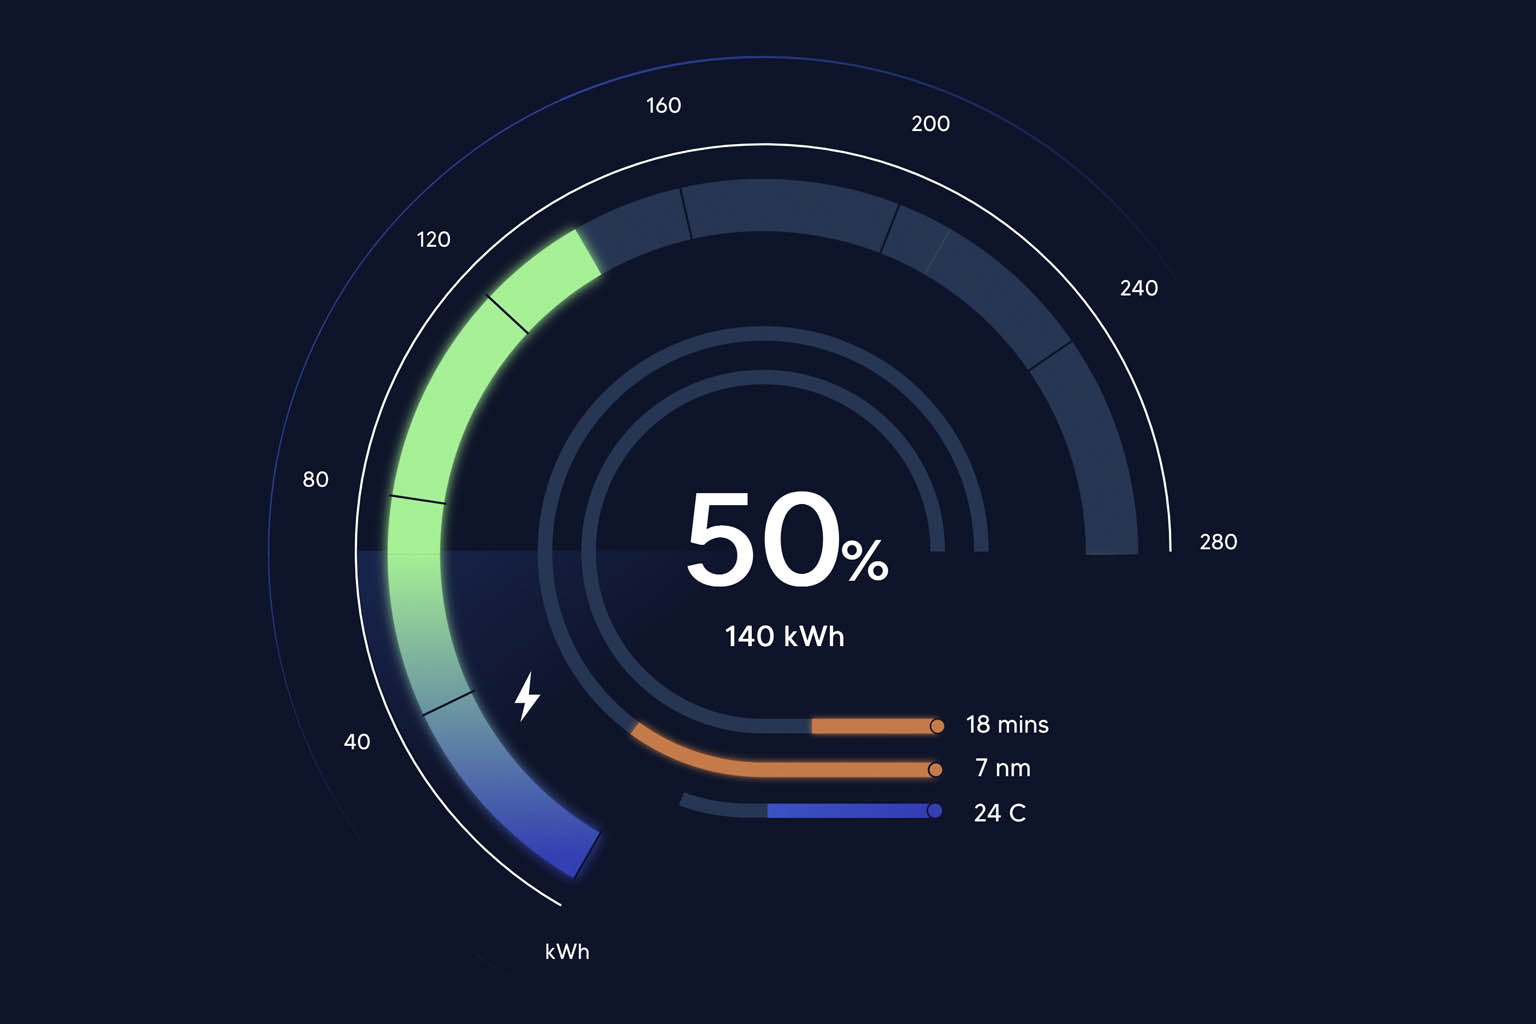
Data Visualisation Best Practices The wrong chart type or a cluttered layout can make accurate data genuinely misleading. We apply proven data visualisation principles to ensure charts, graphs, and metrics are presented clearly and meaningfully, helping users focus on what matters most.
Customisation and Scalability Reporting requirements change. New metrics get prioritised, new audiences come on board, new data sources get added. We design systems that are customisable and scalable so your dashboard grows with your business rather than against it.
Consistency Across Platforms We ensure your analytic dashboard is responsive and works seamlessly across different devices. Whether on a desktop, tablet, or mobile, a consistent user experience fosters trust and reliability across your organisation.
Typical design and development deliverables include:
Typical design and development deliverables include:
UX Design Phase
- Detailed user flows and journeys for key user and analyst groups.
- Wireframes with light UI design, moving to production quickly for rapid iteration and testing.
- High fidelity wireframes for desktop and mobile, showing recommended user journeys through analytic content.
- Expanded user profile summaries to address any challenges identified during discovery.
UI Design Phase
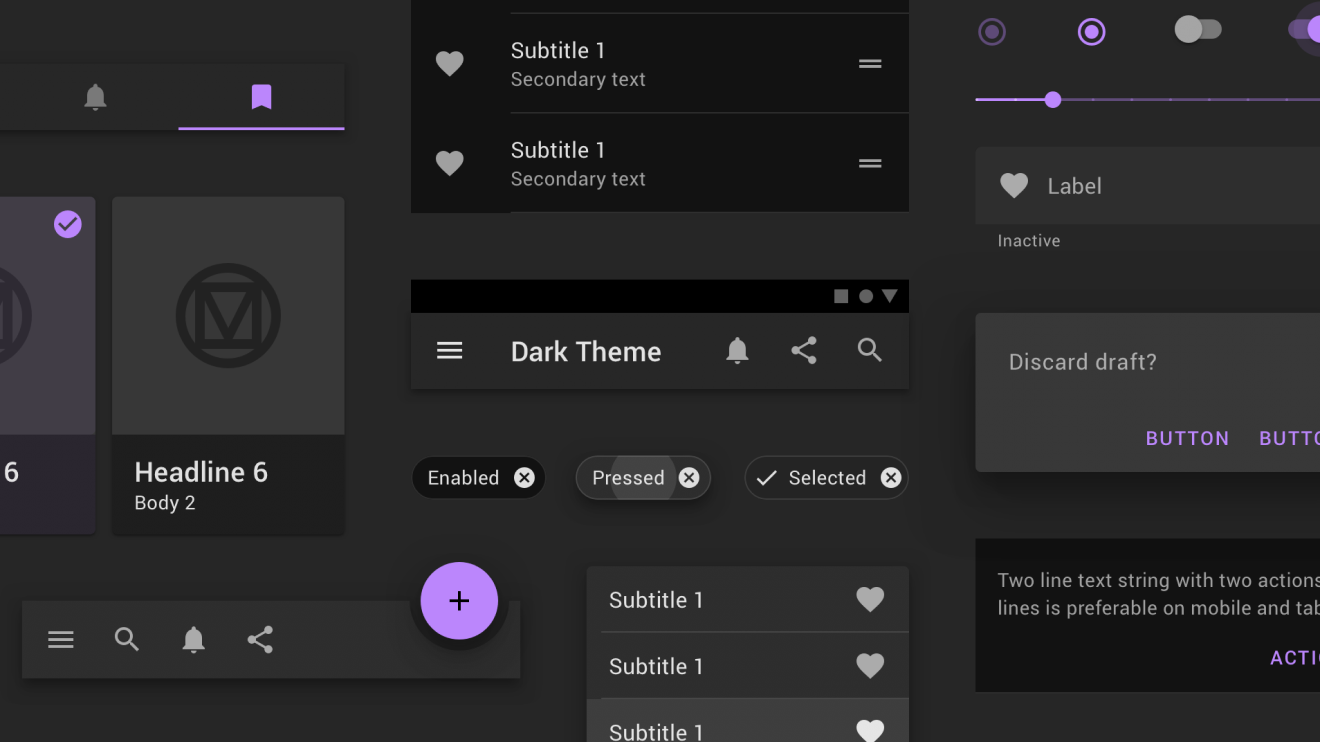
- Design of all UI elements and modules, including templates, annotations, and documentation for development and scalability.
- High fidelity clickable screens in a Figma prototype with annotations and example analytic interactions.
Front End Development Phase
- Use of frameworks such as React, Next, or Vue, ensuring the design system is manageable, and development of HTML, CSS, and JS template screens enabling build out by your in house development team.
- A design system of HTML, CSS, and JS components hosted on GitHub or BitBucket, following modern guidelines for future proofing.
- We keep every analytic dashboard functional, elegant, and lightning fast using modern technology.