How to Build User Trust in AI-Dashboards

Dashboards are increasingly shifting from static reports into AI-infused decision tools, but this evolution brings a critical challenge: users often question AI-generated insights, even when they’re accurate. If an AI agent gives an user an answer in ten seconds but it takes minutes of fact-checking the result and ensuring it didn’t hallucinate a calculation, you may not have made meaningful progress. You’ve potentially traded dashboard fatigue for verification debt. AI answers in analytics are probabilistic, not guaranteed; they are not always correct. Dear reader, I’m assuming you have come across this phenomenon either professionally or personally and not only is it frustrating but it quickly erodes user trust in the product. Being able to design a successful UX around this reality is challenging but not impossible.
Traditional vs. AI-Enhanced Architecture
Consider a sales executive trying to understand Q4 revenue performance. In a traditional dashboard workflow, the path is straightforward:
Traditional Dashboard Flow:
Start → View static Q4 revenue chart
Revenue down 8%? → Drill into regional breakdown
EMEA underperforming? → Filter by product line
SaaS revenue declining? → Export data for further analysis
Cross-reference with CRM → Make decision
End
The trust model is relatively simple: “I know where this came from.” Much of the verification work happened at build time when someone created the dashboard. Both traditional and AI systems still depend on ongoing data quality and governance, but traditional dashboards front-load more verification work at build time. The user’s primary job is interpretation.
AI-Enhanced Dashboard Flow:
One useful way to think about the AI-enhanced flow is through this pattern:
Start → Ask “Why is Q4 revenue down?”
AI interprets query → Does it mean total revenue or a specific segment?
AI pulls data sources → Salesforce? Stripe? Both?
AI applies business logic → Which filters? What time period?
AI generates answer: “Revenue down 8% due to EMEA SaaS decline”
User verifies interpretation → Did AI understand the question correctly?
User checks data sources → Are these the right systems?
User validates logic → Are assumptions correct?
User explores reasoning → What if we exclude one-time adjustments?
Make decision
End
AI-enhanced systems can introduce multiple verification steps. Users may need to validate that the AI understood their question correctly, pulled the right data, applied appropriate business logic, and didn’t hallucinate a metric. The user journey often becomes: Ask, Explore, Verify, Decide; a mental model that highlights where trust and verification show up in the flow. The trust model shifts to: “I can see how this was derived.”
Here’s the challenge: if the dialogue load becomes too heavy, if users need to verify everything through multiple conversation turns, the model can break down. However, this verification debt is a risk or common pattern, not an inevitability for every AI dashboard. So how do we address that?
Step 1: Build Your Semantic Foundation First
Before writing any AI code, establish a governed metric foundation. If teams are arguing about which dashboard has the real number, AI will just give you faster wrong answers. A governed semantic foundation is strongly recommended; increasingly necessary for reliable AI analytics.
This isn’t a quick task. Building a proper semantic foundation often requires months of cross-functional work, though the timeline varies considerably depending on organisational scope and complexity:
Cross-functional alignment: Data teams, finance, product, and sales must align on definitions. For large, multi-team organisations, expect weekly working sessions and dozens of stakeholder reviews over several months.
Cataloging every metric in use: Many organisations discover they have 50+ definitions of “active user” or “revenue” scattered across teams. Each must be documented, reconciled, and standardised.
Creating a centralised semantic layer: This is your single source of truth where every KPI has exactly one definition. Modern semantic layers (like dbt Semantic Layer, Cube, or AtScale) sit between your data warehouse and consumption tools, enforcing consistency.
Documenting business rules explicitly: Every metric needs its filters, time periods, exclusions, and edge cases documented. “Monthly Recurring Revenue” might seem straightforward until you discover your renewal team excludes implementation fees while finance includes them.
Versioning your metrics: When definitions change, you must track what changed and when. This creates an audit trail so you can explain why Q3’s number differs from what was reported in Q4’s comparison.
Having hard conversations: Why do three different teams report three different revenue numbers? Pick one. Document why. Communicate the change. This is organisational change management, not just technical work.
This is the current price of admission for AI analytics. Without it, AI trained on inconsistent data produces inconsistent outputs. Purely ad hoc, ungoverned approaches usually produce weak, inconsistent results; outputs built upon a shaky semantic layer will undermine everything that follows.
Step 2: Design Transparency into Every Output
AI may be a new and changing technology, but clear content is an old rule for a reason: it builds trust. And trust builds more engagement. The key is surfacing two types of information: data provenance and business-relevant reasoning.
Data Source Transparency
Annotate every AI-generated insight with technical provenance:
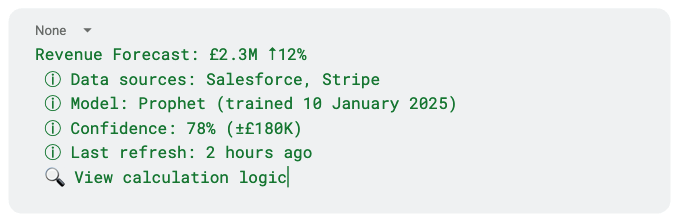
Users don’t need to ask where the number came from; it’s already there. They don’t need to open another tool to check assumptions; they’re surfaced inline. The conversation flows because verification is embedded, not appended.
Business-Relevant Reasoning
XAI techniques are powerful in theory but often less useful in practice because they’re either too technical or too simplified. Explain predictions in your users’ business language.
Instead of: “feature importance scores: feature_A (0.42), feature_B (0.31)”
Use: “This forecast is driven about 60% by Q4 seasonality, 25% by the new product launch, 15% by marketing spend”
Enable scenario exploration so users can test their intuition: “If marketing spend increases 20%, forecast rises to £2.5M.”
Show the AI’s Reasoning Process
For conversational features, the difference between trusted and abandoned systems often lies in whether the AI shows its logical steps. Not raw SQL, but the reasoning process in human terms.
Instead of: “Your top opportunity is the enterprise segment”
Provide:
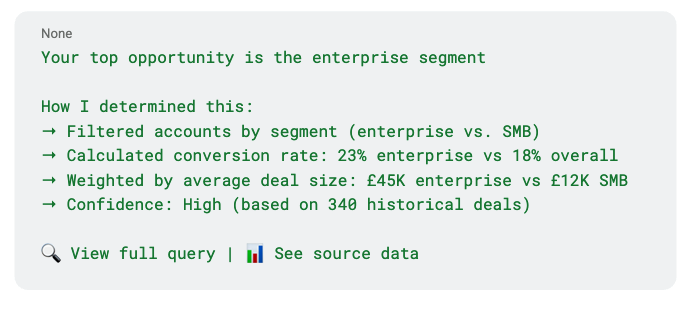
Users want to see the query not because they don’t trust the answer. They want to learn the logic so they can ask better questions next time.
Make Explainability Interactive
Treat explainability as interactive conversation rather than static blocks of text:
User sees: “Churn risk: High for Account X”
Clicks explanation
Sees: “Top factors: 45% usage decline, 2 support tickets, missed last renewal call”
Explores: “What if we resolved the support tickets?”
Gets: “Risk drops to Medium”
This connects explanations to actions users can take. The dialogue stays productive because each turn adds value rather than just confirming what the AI already said.
When the AI makes assumptions or encounters ambiguous input, flag it explicitly: “I interpreted ‘recent’ as last 30 days. Is that what you meant?” This prevents dialogue breakdown. Users don’t need three follow-up turns to clarify what the AI thought they meant. They see it immediately and can course-correct in one message.
Frame Verification as Value-Building
Even good explainability doesn’t eliminate verification work. Business users will cross-check AI insights against trusted dashboards. That’s not failure; it’s trust being built. This is part of the trust-building process, not a sign that AI has failed. Make verification fast enough that AI still provides net value through:
- Inline links to underlying metrics and dashboards
- Quick toggles between AI explanation and canonical KPI views
- Clear labels showing when and how numbers were computed
What Actually Works

Successful implementations follow certain patterns. They’ve significantly reduced dashboard proliferation once agents proved useful, but they continue to maintain critical dashboards for stable, recurring KPIs. They recognise that conversational interfaces help users who intuitively know something is buried in the data but can’t express it clearly. They’ve accepted that trust and reproducibility are the primary barriers and focus areas, not just technology capability. They’ve invested in semantic layers and data governance before adding AI.
Most importantly, they’ve stopped pretending this is either-or. Dashboards and agents solve different problems and work best as complementary tools:
- Dashboards: Stable, shared source of truth for recurring KPIs
- Agents: Flexible, conversational layer for ad hoc, exploratory, or “buried” questions
The future isn’t “dashboard era over.” It’s understanding which tool fits which job and building systems that let users move fluidly between them.
The future of dashboards isn’t AI replacing human judgment. It’s AI making judgment more informed, transparent, and trustworthy whilst giving people their time back. That’s how you unlock AI’s actual potential: not as a replacement for dashboards, but as a complement that makes the whole analytics stack more valuable.
Thanks for the cover photo by Lenin ❤️