How to user test digital tools and applications

User testing is an invaluable way of ensuring that you’ve created a digital tool or application that is intuitive, functional and fit for purpose. Does it do the thing it was built to do?
Indeed, user testing makes up an important part of the larger QA process as it is likely to generate feedback and bug reports (which you can manage in a test management tool) that in-house testers may miss or fail to understand.
Indeed, we find it so valuable that we encourage all our clients to get involved in testing as it often helps product owners develop a deeper understanding of the digital product’s functionality.
As part of any QA process, we focus on two main streams of user testing – qualitative and quantitative.
Qualitative user testing
Qualitative user testing is generally the more time-consuming of the two. Still, it can cast some valuable insight as to how your product is performing and where improvements can be made.
Measuring a digital tool or application’s success with qualitative data requires face-to-face communication with users. Because of this, it usually takes a little more organisation in to capture and analyse the data. The two methods we typically run for qualitative user testing are:
Shadowing
This is extremely useful for understanding a user’s decision-making process, potential blockers and errors in design. By allowing users to guide us through their actions, decisions and concerns, we’re able to quickly gather feedback that we can then analyse as a group at the end of the day. This task can also be followed by one-to-one interviews that offer another opportunity to analyse user feedback and discuss solutions. We help write the user tasks and ask interviewers to record their findings at the end of each phase using Google Docs, ready for discussion with the group. Below is an example of shadowing with the Greater London Authority whilst testing the London Growth Hub platform.
System Usability Scale (SUS)
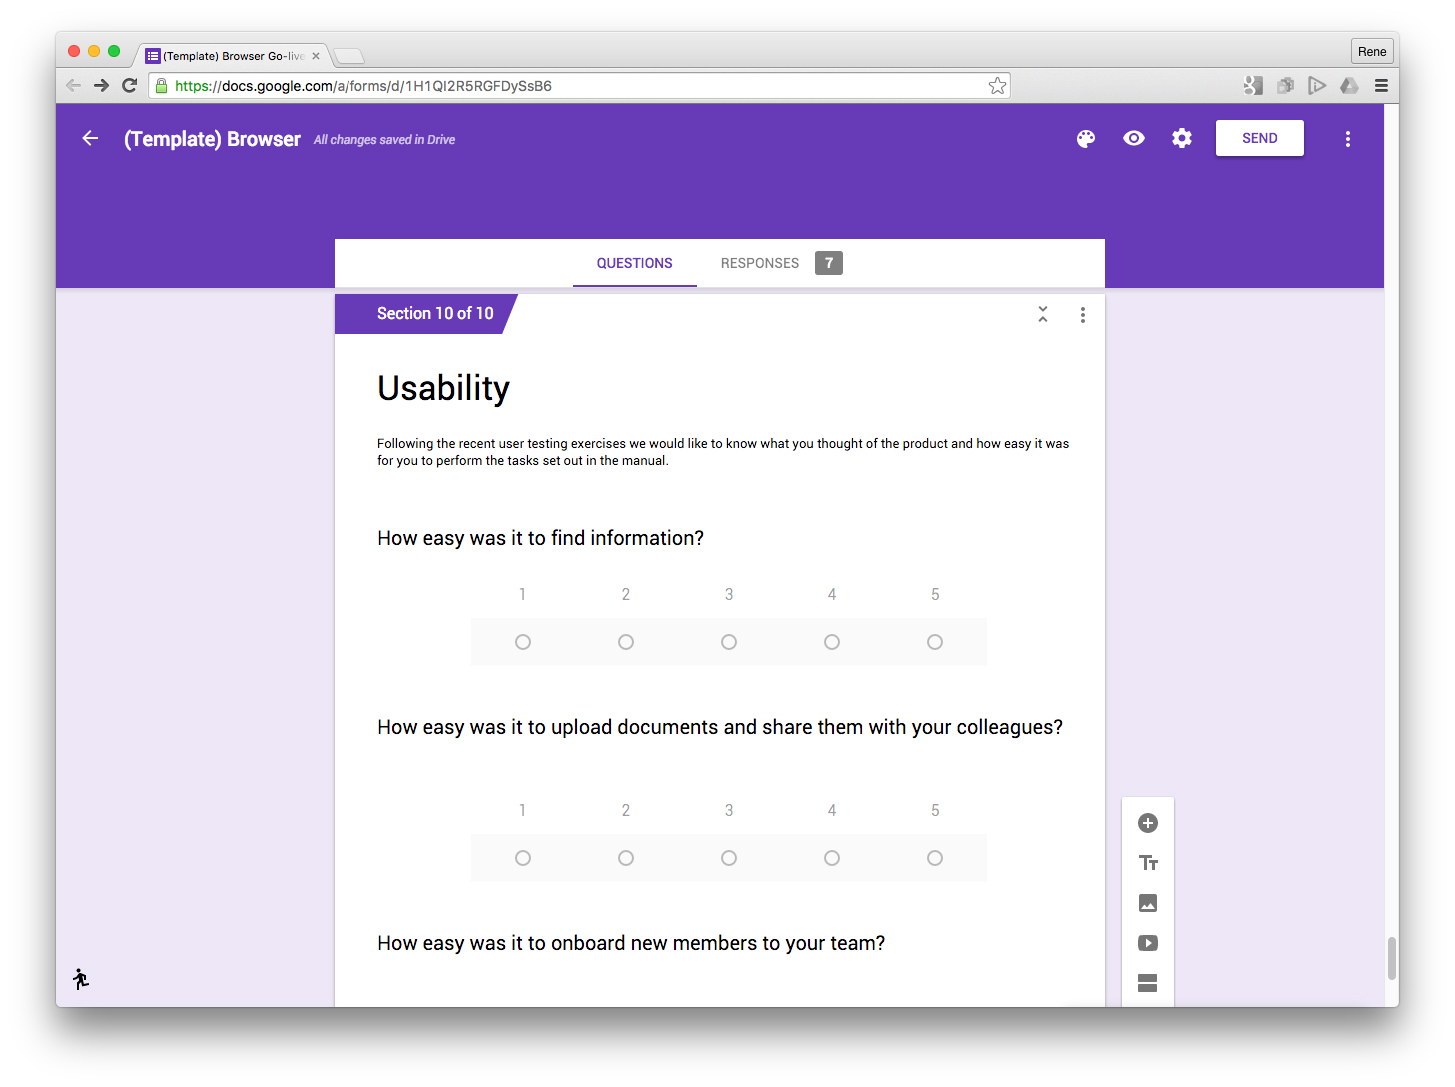
This is one of the most widely used tools for assessing the perceived usability of a product by a user. This KPI (Key Performance Indicator) measuring exercise is based on user surveys and therefore cannot be calculated simply based on statistical data; it requires user participation. SUS is a way to quantify qualitative data like a user’s perceived satisfaction of the product. It consists of up to ten statements to which users rate their level of agreement on a five-point scale; this works in conjunction with the shadowing above. We normally write questions for users to answer and record at the end of each phase, and these results can be recorded using Google Forms (or Survey Monkey) so they are ready to discuss and analyse with the group.
Quantitative user testing
Quantitative user testing focuses on gathering large amounts of data and then measuring that data against pre-agreed KPI’s.
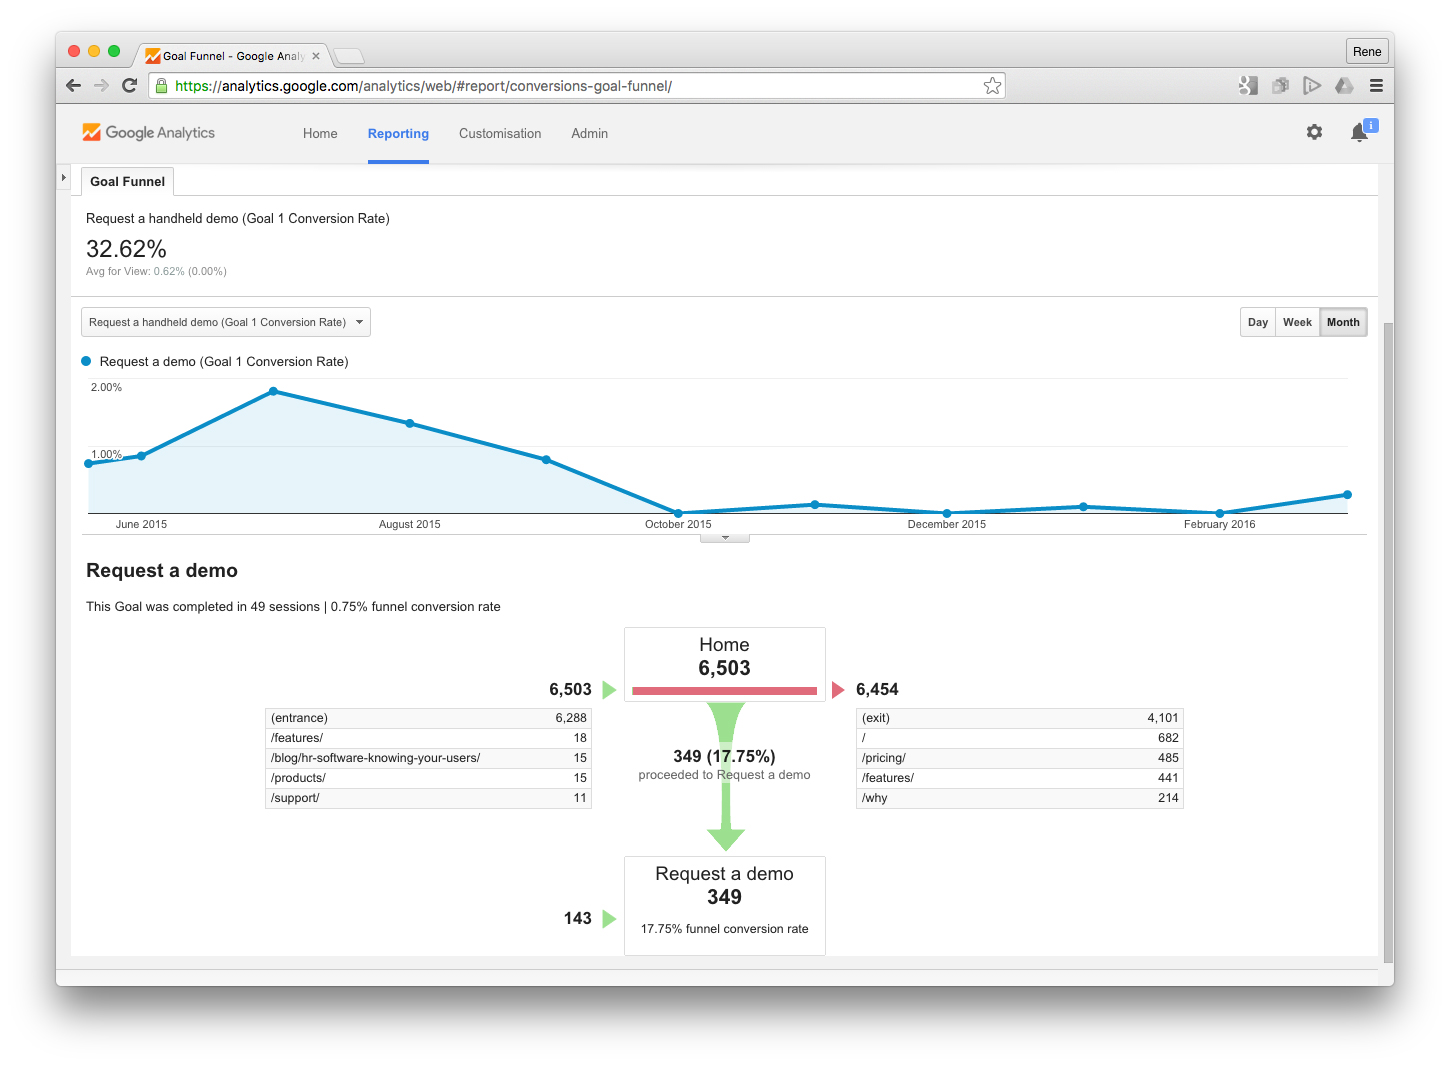
Task success rate
A task success rate is the percentage of correctly completed tasks. Here we measure the success rate from a clearly defined goal or endpoint (such as completing a registration form). Google Analytics is a great tool to use for collecting these metrics. You can easily set up ‘Goals’ on things like buttons, links and URLs. Google will track the number of goal completions taken and compare this to the number of visitors on the site, giving you a nice percentage.
Time on task
This metric is basically the amount of time it takes the user to complete the task, expressed in minutes and seconds. Generally, the smaller the time-on-task metric, the better the user experience. Time on task data can be analysed and presented in different ways, but the most common way is to present the average time spent on each task. Again this can be tracked using Google Analytics and setting up the ‘Goals’ function.
Use of search vs. navigation
This is a valuable metric for evaluating the efficiency of information architecture and navigation. Usually, when users try to find something through navigation and get lost, a search is their final option. This technique is also useful when tracking how well your organic search is performing, you can measure how and what users are searching for when locating your information.
User error rate
The number of user errors can highlight where the product may need to be improved. By recording how many mistakes were made and where, we’re able to begin gauging how usable the product really is. Simple errors such as entering an email address into the telephone field can constitute an error, and simple user testing is a great way of highlighting these little niggles. As before these errors can be tracked and recorded using various tools such as Google Analytics.
Using the data and feedback
After the user testing is complete, we analyse the data. If a user finds the product difficult to use then we use their feedback to make the necessary amendments and retest it. If the data shows common errors then we discuss, draw conclusions and make changes where required.
Ideally, we suggest running a structured testing process like this as part of a continuous improvement program (CIP), meaning testing takes place during Alpha, Beta, then again at three, six and twelve months post-launch. This last round of testing (at three, six, twelve months) really helps everyone to assess the product’s performance with real users and real data.